- Biopython Tutorial
- Biopython - Home
- Biopython - Introduction
- Biopython - Installation
- Creating Simple Application
- Biopython - Sequence
- Advanced Sequence Operations
- Sequence I/O Operations
- Biopython - Sequence Alignments
- Biopython - Overview of BLAST
- Biopython - Entrez Database
- Biopython - PDB Module
- Biopython - Motif Objects
- Biopython - BioSQL Module
- Biopython - Population Genetics
- Biopython - Genome Analysis
- Biopython - Phenotype Microarray
- Biopython - Plotting
- Biopython - Cluster Analysis
- Biopython - Machine Learning
- Biopython - Testing Techniques
- Biopython Resources
- Biopython - Quick Guide
- Biopython - Useful Resources
- Biopython - Discussion
Biopython - Genome Analysis
A genome is complete set of DNA, including all of its genes. Genome analysis refers to the study of individual genes and their roles in inheritance.
Genome Diagram
Genome diagram represents the genetic information as charts. Biopython uses Bio.Graphics.GenomeDiagram module to represent GenomeDiagram. The GenomeDiagram module requires ReportLab to be installed.
Steps for creating a diagram
The process of creating a diagram generally follows the below simple pattern −
Create a FeatureSet for each separate set of features you want to display, and add Bio.SeqFeature objects to them.
Create a GraphSet for each graph you want to display, and add graph data to them.
Create a Track for each track you want on the diagram, and add GraphSets and FeatureSets to the tracks you require.
Create a Diagram, and add the Tracks to it.
Tell the Diagram to draw the image.
Write the image to a file.
Let us take an example of input GenBank file −
https://raw.githubusercontent.com/biopython/biopython/master/Doc/examples/ls_orchid.gbk and read records from SeqRecord object then finally draw a genome diagram. It is explained below,
We shall import all the modules first as shown below −
>>> from reportlab.lib import colors
>>> from reportlab.lib.units import cm
>>> from Bio.Graphics import GenomeDiagram
Now, import SeqIO module to read data −
>>> from Bio import SeqIO
record = SeqIO.read("example.gb", "genbank")
Here, the record reads the sequence from genbank file.
Now, create an empty diagram to add track and feature set −
>>> diagram = GenomeDiagram.Diagram(
   "Yersinia pestis biovar Microtus plasmid pPCP1")
>>> track = diagram.new_track(1, name="Annotated Features")
>>> feature = track.new_set()
Now, we can apply color theme changes using alternative colors from green to grey as defined below −
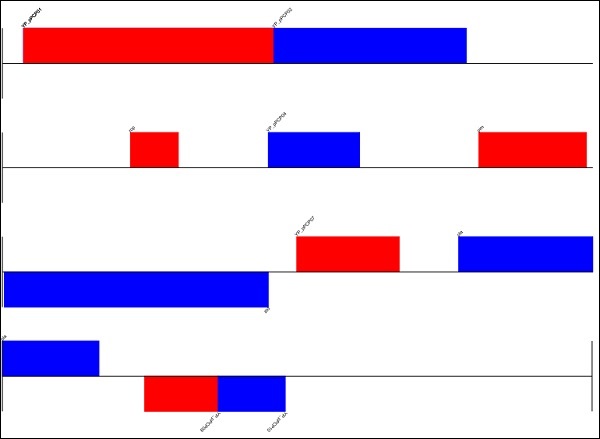
>>> for feature in record.features:
>>>    if feature.type != "gene":
>>>       continue
>>>    if len(feature) % 2 == 0:
>>>       color = colors.blue
>>>    else:
>>>       color = colors.red
>>>
>>>    feature.add_feature(feature, color=color, label=True)
Now you could see the below response on your screen −
<Bio.Graphics.GenomeDiagram._Feature.Feature object at 0x105d3dc90>
<Bio.Graphics.GenomeDiagram._Feature.Feature object at 0x105d3dfd0>
<Bio.Graphics.GenomeDiagram._Feature.Feature object at 0x1007627d0>
<Bio.Graphics.GenomeDiagram._Feature.Feature object at 0x105d57290>
<Bio.Graphics.GenomeDiagram._Feature.Feature object at 0x105d57050>
<Bio.Graphics.GenomeDiagram._Feature.Feature object at 0x105d57390>
<Bio.Graphics.GenomeDiagram._Feature.Feature object at 0x105d57590>
<Bio.Graphics.GenomeDiagram._Feature.Feature object at 0x105d57410>
<Bio.Graphics.GenomeDiagram._Feature.Feature object at 0x105d57490>
<Bio.Graphics.GenomeDiagram._Feature.Feature object at 0x105d574d0>
Let us draw a diagram for the above input records −
>>> diagram.draw(
   format = "linear", orientation = "landscape", pagesize = 'A4',
   ... fragments = 4, start = 0, end = len(record))
>>> diagram.write("orchid.pdf", "PDF")
>>> diagram.write("orchid.eps", "EPS")
>>> diagram.write("orchid.svg", "SVG")
>>> diagram.write("orchid.png", "PNG")
After executing the above command, you could see the following image saved in your Biopython directory.
** Result **
genome.png
You can also draw the image in circular format by making the below changes −
>>> diagram.draw(
   format = "circular", circular = True, pagesize = (20*cm,20*cm),
   ... start = 0, end = len(record), circle_core = 0.7)
>>> diagram.write("circular.pdf", "PDF")
Chromosomes Overview
DNA molecule is packaged into thread-like structures called chromosomes. Each chromosome is made up of DNA tightly coiled many times around proteins called histones that support its structure.
Chromosomes are not visible in the cell’s nucleus — not even under a microscope —when the cell is not dividing. However, the DNA that makes up chromosomes becomes more tightly packed during cell division and is then visible under a microscope.
In humans, each cell normally contains 23 pairs of chromosomes, for a total of 46. Twenty-two of these pairs, called autosomes, look the same in both males and females. The 23rd pair, the sex chromosomes, differ between males and females. Females have two copies of the X chromosome, while males have one X and one Y chromosome.