- Power BI - Home
- Power BI - Introduction
- Power BI - Installation Steps
- Power BI - Architecture
- Power BI Desktop
- Power BI - Desktop
- Power BI - Desktop Window
- Power BI Service
- Power BI - Window Supported Browsers
- Power BI - Generating Reports
- Power BI Desktop Service
- Power BI - Desktop vs Service
- Power BI - Supported Data Sources
- Power BI - Comparison Tools
- Power Query Editor
- Power Query Editor - Introduction
- Power Query Editor - Data Discrepancy
- Power Query Editor - Merge Queries (Part 1)
- Power Query Editor - Merge Queries (Part 2)
- Power BI - Develop Star Schema
- Data Modeling Concepts
- Power BI - Data Modeling
- Power BI - Manage Relationships
- Power BI - Cardinality
- Power BI - Dashboard Options
- Power BI Report Visualizations
- Power BI - Visualization Options
- Power BI - Visualization Charts
- Power BI - Stacked Bar Chart
- Power BI - Stacked Column Chart
- Power BI - Clustered Chart
- Power BI - 100% Stacked Chart
- Power BI - Area Chart and Stacked Area Chart
- Power BI - Line and Stacked Column Chart
- Power BI - Line and Clustered Column Chart
- Power BI - Ribbon Chart
- Power BI - Table and Matrix Visuals
- Power BI Map Visualizations
- Power BI - Creating Map Visualizations
- Power BI - ArcGIS Map
- Power BI Miscellaneous
- Power BI - Waterfall Charts
- Funnel Charts and Radial Gauge Chart
- Power BI - Scatter Chart
- Power BI - Pie Chart and Donut Chart
- Power BI - Card and Slicer Visualization
- Power BI - KPI Visual
- Power BI - Smart Narrative Visual
- Power BI - Decomposition Tree
- Power BI - Paginated Report
- Power BI - Python Script & R Script
- Power BI - Multi-row Card
- Power BI - Power Apps & Power Automate
- Power BI - Excel Integration
- Power BI Dashboard
- Power BI - Sharing Dashboards
- Power BI Sales Production Dashboard
- Power BI - HR Analytics Dashboard
- Power BI - Customer Analytics Dashboard
- Power BI - DAX Basics
- Power BI - Administration Role
- Power BI - DAX Functions
- Power BI - DAX Text Functions
- Power BI - DAX Date Functions
- Power BI - DAX Logical Functions
- Power BI - DAX Counting Functions
- Power BI - Depreciation Functions
- Power BI - DAX Information Functions
Power BI - DAX Logical Functions
In this chapter, the DAX logical functions along with their examples are carried out. It is very helpful for making major business decisions and permits users to manipulate the data swiftly.
What are DAX's Logical Functions?
The logical values will be obtained which are dependent on the logical operations applied to the specified parameters.
Scenario − The problem statement is that you have to identify whether students have passed or failed the final examination through these logical DAX functions. You need to load the student dataset into the BI desktop before executing these functions.
Let's commence with DAX logical functions one by one −
DAX AND Function
It comprises two parameters that specify the logical conditions and return false if both constraints are incorrect and vice versa.
Example − If the student's marks are greater than 40 and practical marks greater than 2 then the AND function will fill up "TRUE" values for this condition otherwise "False" value will be filled up in the new column cal.
cal = AND(Sheet1[Theory Marks]>40,Sheet1[Practical Marks]>2)
The resulting value is shown in the cal column.

What in case you have to fill data value according to your choice? By default, the AND function will return only a "True/False" value. To overcome this problem AND can used inside the IF function. IF functions can effectively work with other logical functions like AND, and OR functions.
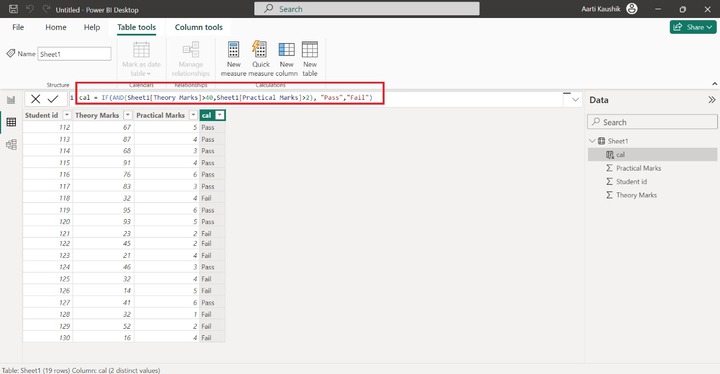
Example − Write the expression in the formula −
cal = If(AND(Sheet1[Theory Marks]>40,Sheet1[Practical Marks]>2),"Pass", "Fail")
If both conditions inside the AND function are correct, then "Pass" will return otherwise "Fail" will retrieve.
DAX OR Function
It will return True if any of the two specified logical tests is correct otherwise it will return False.
Example − Enter the expression in the formula bar −
cal = If(OR(Sheet1[Theory Marks]>40,Sheet1[Practical Marks]>2),"Pass", "Fail")
Therefore, the above expression is being evaluated and the computed value is displayed in the cal column.

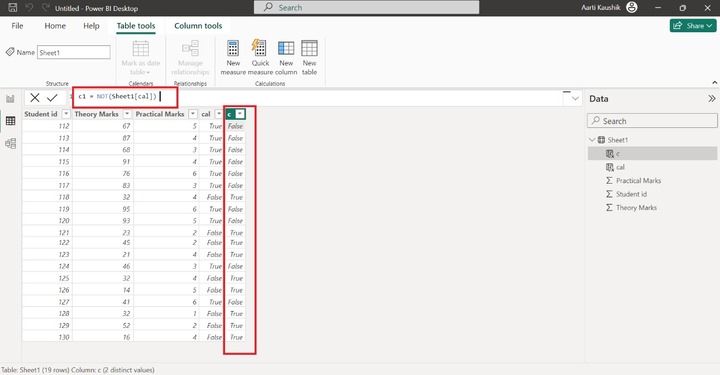
DAX NOT Function
It transforms the True entries into the False entries and vice versa.
Example − You have already computed the given expression in the fourth column cal.
cal = AND(Sheet1[Theory Marks]>40,Sheet1[Practical Marks]>2)
Switch to the "Table Tools" tab and click on the "New column" to append the new column to the existing table.
Write the expression −
c1 = NOT(Sheet1[cal])
Here, you can notice that the reverse value of the cal column is displayed in the c1 column.
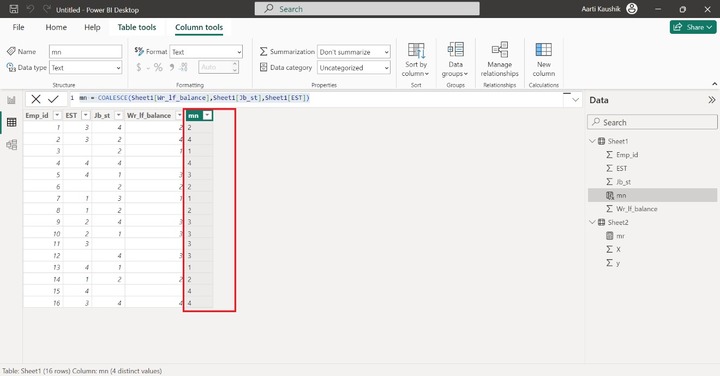
DAX COALESCE Function
It will return the first parameter value if it does not contain a null value otherwise, it will return the second parameter value furthermore if the second parameter contains null values, then it will extract the third parameter value and if all the specified parameters contain null values, then it will retrieve the blank.
Example − Enter the given expression in the formula bar.
mn = COALESCE(Sheet1[Wr_lf_balance],Sheet1[Jb_st],Sheet1[EST])
Here, you can observe in the screenshot, that the computed result is displayed in the mn column.
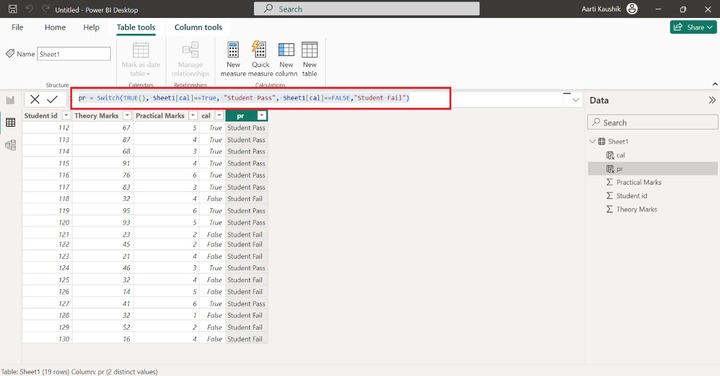
DAX Switch Function
It verifies the multiple conditions and retrieves distinct outputs based on the specified function. Row calculation is not performed with the switch function. It applies to manipulating only column-based values.
Example − You may write the expression for the new column −
pr = Switch(TRUE(), Sheet1[cal]==True, "Student Pass", Sheet1[cal]==FALSE,"Student Fail")
Here, different expressions are evaluated, and the corresponding output is generated accordingly.
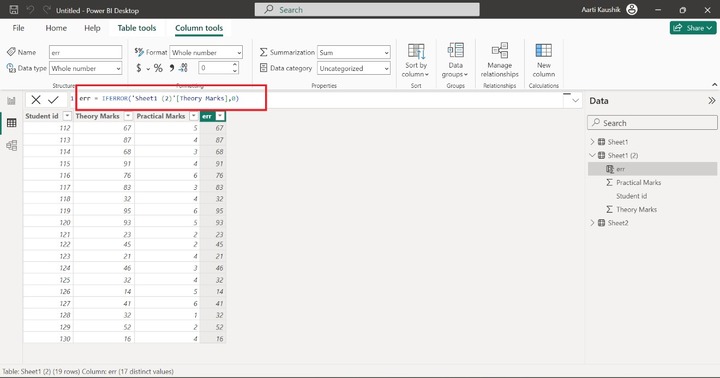
DAX IFERROR Function
The expression is verified and if it contains an error then it retrieves a corresponding value defined by the user. Otherwise, retrieves the expression value itself.
Example − Enter the expression −
err = IFERROR('Sheet1 (2)'[Theory Marks],0)
As you can notice in the screenshot, the "Theory Marks" column does not contain Error values. Therefore, the same data values are returned from the "Theory Marks" into in the Err column.
Another way to execute the IFERROR function is through a new measure. Navigate to the "Table Tools" and click on "New Measure" and enter the expression −
m1=IFERROR(87/0,"Infinity")

DAX Logical Functions
The remaining DAX logical functions are listed in the given table −
| Functions | Description | Example |
|---|---|---|
| BITAND | It will return the BITAND of the two specified numbers. | BITAND(2,5) |
| BITOR | It will return the BITOR of the two specified numbers. | BITOR(8,5) |
| BITLSHIFT | The number of bits will be moved to the left according to the designated shift amount and retrieve the computed number. | BITLSHIFT(12,5), here 5 is the shift amount |
| BITXOR | It will perform BITXOR of two specified numbers. | BITXOR(12,5) |
| TRUE | The True value is retrieved by this function. | TRUE() |
| FALSE | The False value is retrieved by the False function. | FALSE() |
| IF.EAGER | Multiple conditions are cross-checked; it will return a value if the logical condition is correct, else another value will be retrieved. | IF.EAGER(Sheet1[Emp_id]>3, True, FALSE) |
The implementation of DAX logical functions in Power BI Desktop is showcased in this chapter. These are very powerful functions for data modelling, to improve business performance and also decrease human errors, and are helpful for organizational growth.
