
Article Categories
- All Categories
-
 Data Structure
-
 Networking
-
 RDBMS
RDBMS
-
 Operating System
-
 Java
Java
-
 MS Excel
-
 iOS
iOS
-
 HTML
HTML
-
 CSS
CSS
-
 Android
-
 Python
-
 C Programming
-
 C++
C++
-
 C#
C#
-
 MongoDB
-
 MySQL
MySQL
-
 Javascript
-
 PHP
PHP
-
 Economics & Finance
Explain the concept of Report View, Data View, and Model View in Power BI
Power BI is a good tool with three major views Report View, Data View, and Model View which we will discuss in this article. Power BI can be useful for an individual who wants to derive some useful insights from the data and permits users to visualize. In short, it can be defined as a tool used to connect different data sources, by transforming and modeling data, creating an interactive visual report, and sharing these reports with others. Power BI is developed to help organizations and individuals make data-driven decisions by turning raw data into actionable insights.
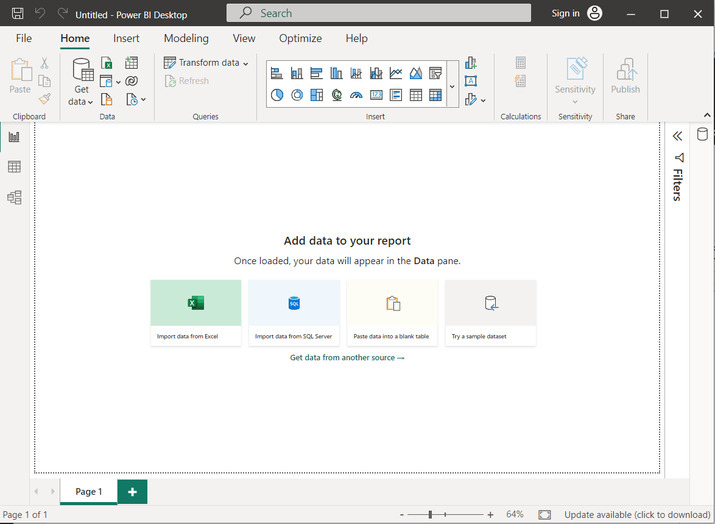
The first window the user will see after opening the Power BI software will appear as given below
The three major views in Power BI are listed below
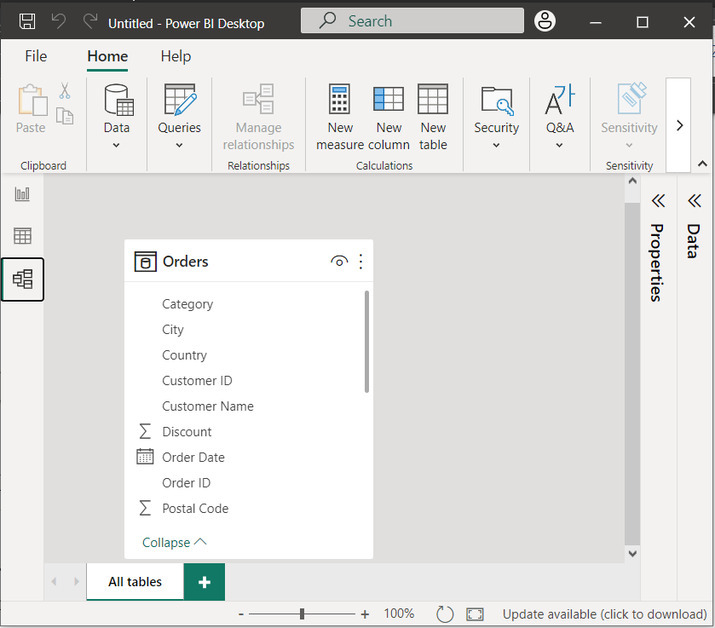
Data View
This view can be used when the user wants to connect to different data sources, transform and shape the data, and create data models.
It also helps users to import data from different sources. It is useful to transform and cleanse the data to make the data useful.
This view is important to observe the data accepted by importing data from any source.
It displays all the data. By observing the data, the user can make changes to the existing data, without any issue.
This view also provides some features and options for sorting, grouping, and merging data. By using this data, the user can be able to create the required reports and visuals.
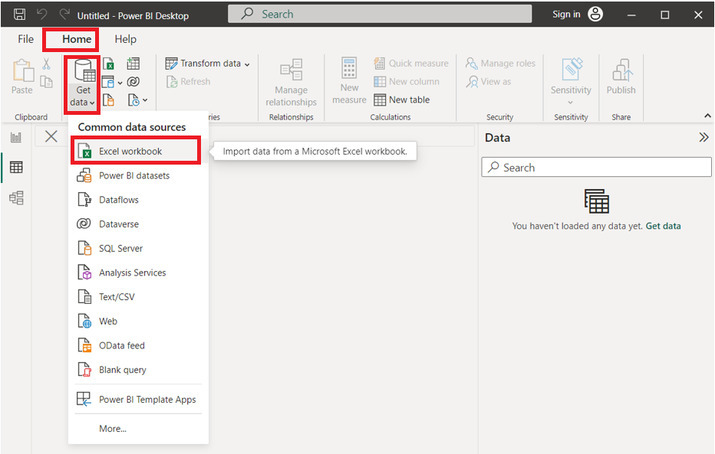
To import the Excel sheet to the data view
Step 1
First, go to the "Get data" option, and then select the option "Excel workbook". A snapshot for the same is provided below
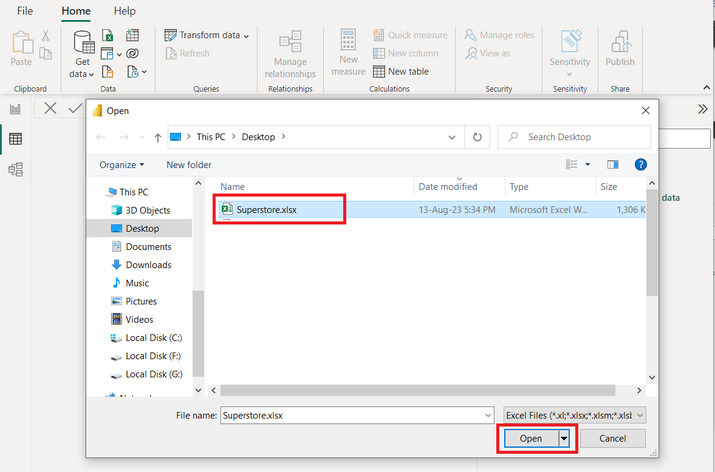
Step 2
The above step will display the open dialog box. This dialog box will allow the user to browse the file. Select the file name and click on the "Open" button.
Step 3
The provided Excel sheet contains three Excel sheets, but here will be importing the orders table only. Select the tick mark for the "Orders" table, and then click on the "Load" option. A snapshot for the same is provided below

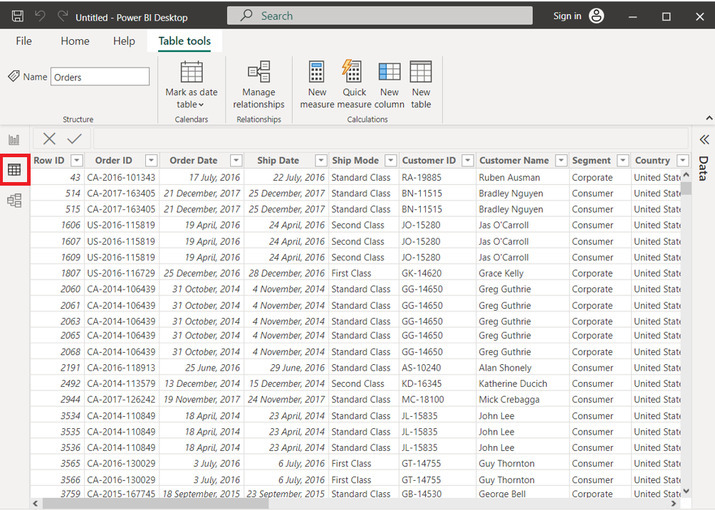
Step 4
This will load the orders table to the Power BI editor. This editor contains three major views on the left side pane. Click on the second highlight view, which is data view. This view shows the imported data values as a table. Snapshot for user reference is provided below
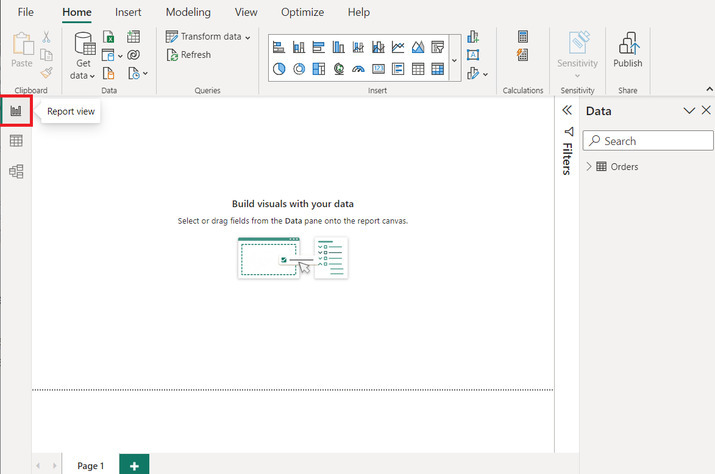
Report View
This view can be used when the user wants to create some interactive visuals from the provided data sets.
By using this feature users can easily create interactive visualizations and reports. Another major benefit of using this is the visual elements such as charts, tables, matrices, maps, and more.
Users can customize these visuals by adjusting the colors, fonts, labels, and other formatting options.
In this view, user can also create the calculated columns, measures, and KPIs using a language called DAX (Data Analysis Expressions). Click on the first option of the left pane, as highlighted below. This will open the report?s view. In this view user can insert any required visual as specified above properly.
Snapshot for a report view window is provided below
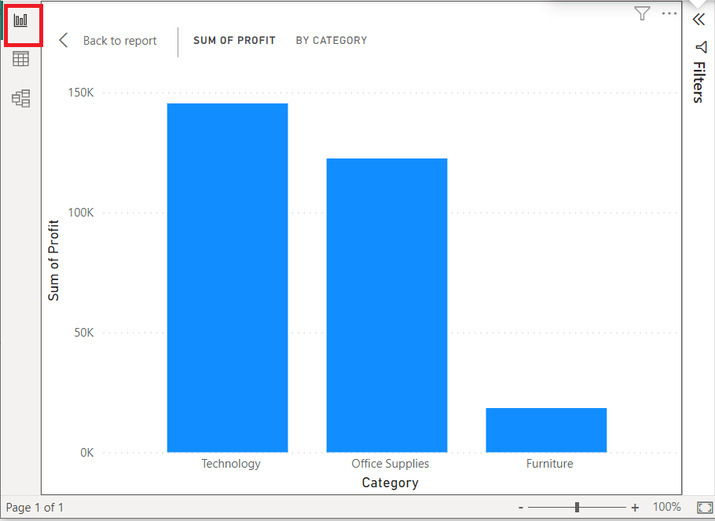
Please understand that the report view contains the required visuals such as stacked charts and many others. To clarify the statement more precisely let?s consider the example provided below of the stacked column graph. For category and profits will understand the process of developing the same in the next tutorials. Snapshot for the same is attached below
Model View
This option allows the user to understand the relation between the provided data values.
It is useful when the user wants to understand table structure. It creates UML diagrams, to state the relationships and attributes of the provided data.
It is important to understand the relationship between the correctly defined and managing relationships between tables which is essential for accurate data analysis and visualization
To see the relationship simply click on the third tab option provided on the left side, same is highlighted in the below provided snapshot
Conclusion
Power BI enables users to connect to data, transform and model it, and then create insightful visual reports to help the business make informed decisions. The above-provided topic briefly explains the three major views of the Power BI.

2K+ Views
