 Data Structure
 Networking
 RDBMS
RDBMS Operating System
 Java
Java MS Excel
 iOS
iOS HTML
HTML CSS
CSS Android
 Python
 C Programming
 C++
C++ C#
C# MongoDB
 MySQL
MySQL Javascript
 PHP
PHP
- Selected Reading
- UPSC IAS Exams Notes
- Developer's Best Practices
- Questions and Answers
- Effective Resume Writing
- HR Interview Questions
- Computer Glossary
- Who is Who
Skin Cancer Detection using TensorFlow in Python
Early detection of any disease, especially cancer, is very crucial for the treatment phase. One such effort made in this direction is the use of machine learning algorithms to detect and diagnose skin cancer with the help of a machine learning framework like Tensorflow.
The traditional method of cancer detection is quite time-consuming and requires professional dermatologists. However, with the help of TensorFlow, not only can this process be made fast, but more accurate and efficient. Moreover, people who do not get timely access to doctors and dermatologists, can use this meanwhile.
Algorithm
Step 1 ? Import the libraries like numpy, pandas, matplotlib, and seaborn, etc and load the image dataset and store it as a list.
Step 2 ? Load this list of images as a pandas dataframe and extract the two labels for each image in the list.
Step 3 ? Convert the labels to symbols 0 and 1 for simplicity and compare the number of images present under each label with the help of a pie chart.
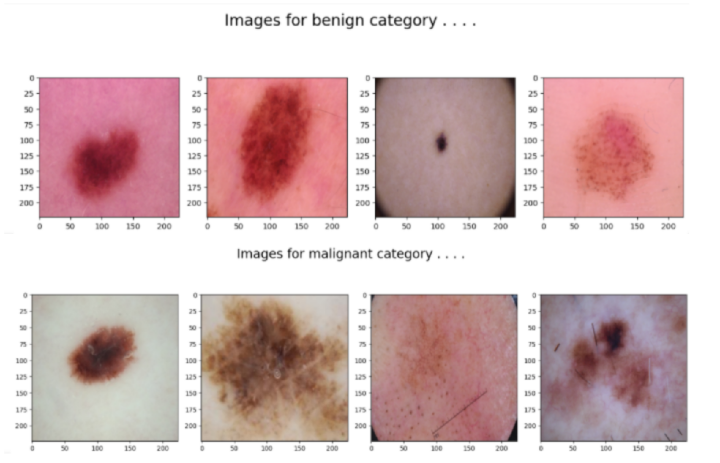
Step 4 ? Print some images for each label if there is no imbalance.
Step 5 ? Split the dataset into a training and testing set.
Step 6 ? Create pipelines for image input.
Step 7 ? Use the EfficientNet architecture to create and compile the model.
Step 8 ? Train the model for at least 5 epochs.
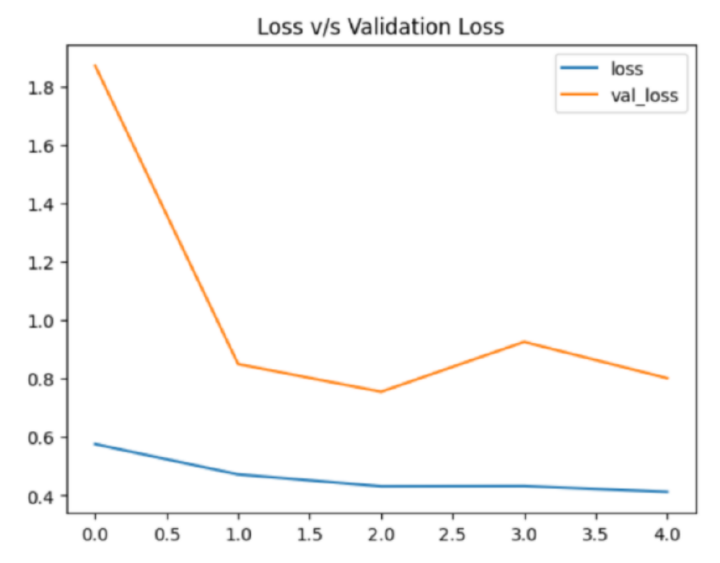
Step 9 ? Visualize the difference between training loss and validation loss.
Example
In this example, we will take a skin cancer dataset with two types of images which you can find here. Then, we will develop a model with the help of TensorFlow to get the desired results without much training. For this, we will also make use of EfficientNet architecture to get pre-trained weights.
#import the required libraries
import numpy as np
import pandas as pd
import seaborn as sb
import matplotlib.pyplot as plt

from glob import glob
from PIL import Image
from sklearn.model_selection import train_test_split

import tensorflow as tf
from tensorflow import keras
from keras import layers
from functools import partial

AUTO = tf.data.experimental.AUTOTUNE
import warnings
warnings.filterwarnings('ignore')

#load the dataset
images = glob('train/*/*.jpg')
len(images)

#create dataset and extract labels
images = [path.replace('', '/') for path in images]
df = pd.DataFrame({'filepath': images})
df['label'] = df['filepath'].str.split('/', expand=True)[1]
print(df.head())

df['label_bin'] = np.where(df['label'].values == 'malignant', 1, 0)
df.head()

#check if both types of files are same in number
x = df['label'].value_counts()
plt.pie(x.values,
        labels=x.index,
        autopct='%1.1f%%')
plt.show()

#printing the images of the two categories
for cat in df['label'].unique():
    temp = df[df['label'] == cat]

    index_list = temp.index
    fig, ax = plt.subplots(1, 4, figsize=(15, 5))
    fig.suptitle(f'Images for {cat} category . . . .', fontsize=20)
    for i in range(4):
        index = np.random.randint(0, len(index_list))
        index = index_list[index]
        data = df.iloc[index]

        image_path = data[0]

        img = np.array(Image.open(image_path))
        ax[i].imshow(img)
plt.tight_layout()
plt.show()

#split the dataset into train and test
features = df['filepath']
target = df['label_bin']

X_train, X_val,\
    Y_train, Y_val = train_test_split(features, target,
                                      test_size=0.15,
                                      random_state=10)

X_train.shape, X_val.shape

def decode_image(filepath, label=None):

    img = tf.io.read_file(filepath)
    img = tf.image.decode_jpeg(img)
    img = tf.image.resize(img, [224, 224])
    img = tf.cast(img, tf.float32) / 255.0

    if label == None:
        return img

    return img, label

#create pipelines for image input
train_ds = (
    tf.data.Dataset
    .from_tensor_slices((X_train, Y_train))
    .map(decode_image, num_parallel_calls=AUTO)

    .batch(32)
    .prefetch(AUTO)
)

val_ds = (
    tf.data.Dataset
    .from_tensor_slices((X_val, Y_val))
    .map(decode_image, num_parallel_calls=AUTO)
    .batch(32)
    .prefetch(AUTO)
)

#building the model architecture using Keras API
from tensorflow.keras.applications.efficientnet import EfficientNetB7

pre_trained_model = EfficientNetB7(
    input_shape=(224, 224, 3),
    weights='imagenet',
    include_top=False
)

for layer in pre_trained_model.layers:
    layer.trainable = False

from tensorflow.keras import Model

inputs = layers.Input(shape=(224, 224, 3))
x = layers.Flatten()(inputs)

x = layers.Dense(256, activation='relu')(x)
x = layers.BatchNormalization()(x)
x = layers.Dense(256, activation='relu')(x)
x = layers.Dropout(0.3)(x)
x = layers.BatchNormalization()(x)
outputs = layers.Dense(1, activation='sigmoid')(x)

model = Model(inputs, outputs)
model.compile(
    loss=tf.keras.losses.BinaryCrossentropy(from_logits=True),
    optimizer='adam',
    metrics=['AUC']
)

#train the model for 5 epochs
history = model.fit(train_ds,
                    validation_data=val_ds,
                    epochs=5,
                    verbose=1)

#checking the loss
hist_df = pd.DataFrame(history.history)
hist_df.head()

#plotting line graph
hist_df['loss'].plot()
hist_df['val_loss'].plot()
plt.title('Loss v/s Validation Loss')
plt.legend()
plt.show()
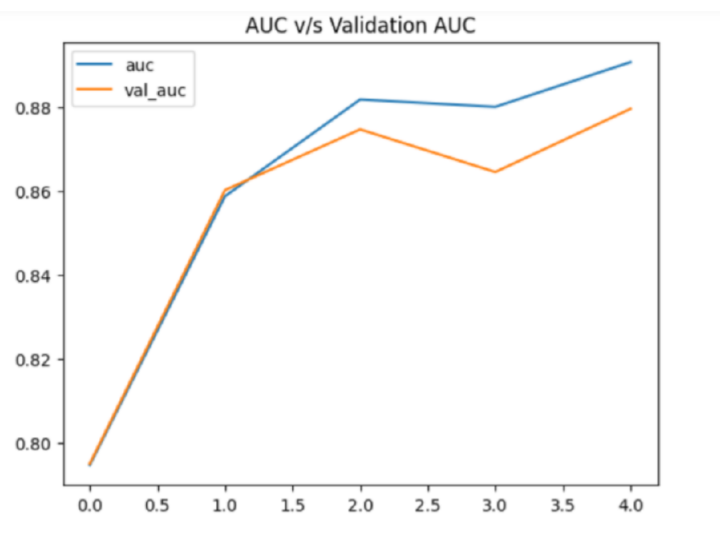
hist_df['auc'].plot()
hist_df['val_auc'].plot()
plt.title('AUC v/s Validation AUC')
plt.legend()
plt.show()
We first load the images stored in our local system and then we create a dataframe to store all the file paths and loaded labels. The stored labels are converted to Binary format such that malignant represents 1 and other labels represent 0.
The later part of code then plots a pie chart that visualizes the distribution of the label classes and counts the occurrences of each class.
We then randomly choose 4 images from each category and print them in a 1x4 grid using Matplotlib. The decode_image() function reads an image file, decodes it and resizes the images. The model is then trained using the fit() method and the training is performed. The history object then returned by the fit() method is used to extract the training and validation loss. The values are then stored in a dataframe.
The loss and validation loss values are plotted using Matplotlib library in Python
Output
               filepath   label
0   train/benign/100.jpg  benign
1  train/benign/1000.jpg  benign
2  train/benign/1001.jpg  benign
3  train/benign/1002.jpg  benign
4  train/benign/1004.jpg  benign

Epoch 1/5
71/71 [==============================] - 28s 356ms/step - loss: 0.5760 - auc: 0.7948 - val_loss: 1.8715 - val_auc: 0.7951
Epoch 2/5
71/71 [==============================] - 25s 348ms/step - loss: 0.4722 - auc: 0.8587 - val_loss: 0.8500 - val_auc: 0.8602
Epoch 3/5
71/71 [==============================] - 24s 336ms/step - loss: 0.4316 - auc: 0.8818 - val_loss: 0.7553 - val_auc: 0.8746
Epoch 4/5
71/71 [==============================] - 24s 331ms/step - loss: 0.4324 - auc: 0.8800 - val_loss: 0.9261 - val_auc: 0.8645
Epoch 5/5
71/71 [==============================] - 24s 344ms/step - loss: 0.4126 - auc: 0.8907 - val_loss: 0.8017 - val_auc: 0.8795


Conclusion
Although TensorFlow performs well enough in the skin cancer detection model, it has its own disadvantages like the use of high computational power or the use of large amounts of memory. Thus, trying out other frameworks like PyTorch, Keras and MXNet, etc would not be a bad idea in order to explore even more possibilities in the field of skin cancer detection using machine learning.

