 Data Structure
 Networking
 RDBMS
RDBMS Operating System
 Java
Java MS Excel
 iOS
iOS HTML
HTML CSS
CSS Android
 Python
 C Programming
 C++
C++ C#
C# MongoDB
 MySQL
MySQL Javascript
 PHP
PHP
- Selected Reading
- UPSC IAS Exams Notes
- Developer's Best Practices
- Questions and Answers
- Effective Resume Writing
- HR Interview Questions
- Computer Glossary
- Who is Who
Show figures independent of screen resolution in Python Tkinter with Matplotlib
When creating data visualization applications using Python's Tkinter and Matplotlib, it is crucial to ensure that the figures displayed are independent of the user's screen resolution. This ensures that the visual representation of the data remains consistent across different devices and screen sizes. In this article, we will explore techniques to achieve screen resolution independence when integrating Matplotlib figures into Tkinter applications.
The challenge arises due to the variation in screen resolutions among different devices. If the figures are not handled properly, they may appear distorted or inconsistent, making it difficult for users to interpret the data accurately. To overcome this challenge, we need to implement techniques that allow the figures to scale appropriately based on the screen resolution.
Setting up the Tkinter Application
Let's begin by setting up a basic Tkinter application that incorporates a Matplotlib figure. This will serve as the foundation for implementing screen resolution independence.
import tkinter as tk
from matplotlib.figure import Figure
from matplotlib.backends.backend_tkagg import FigureCanvasTkAgg

root = tk.Tk()
root.geometry("700x450")
root.title("Screen Resolution Independent Figures")
figure = Figure(figsize=(6, 4), dpi=100)
canvas = FigureCanvasTkAgg(figure, master=root)
canvas.get_tk_widget().pack()

# Add Matplotlib plotting code here
root.mainloop()
In the code above, we import the necessary modules from Tkinter and Matplotlib. We create an instance of Figure and specify the desired size and dpi (dots per inch) values. The FigureCanvasTkAgg class is used to embed the figure into the Tkinter application.
Handling Screen Resolution Independence
To ensure that the figure remains independent of screen resolution, we need to implement the following techniques
DPI Scaling Matplotlib's Figure class allows us to specify the DPI value, which determines the resolution of the figure. By setting the DPI value appropriately, we can ensure that the figure scales correctly across different screen resolutions. Typically, a higher DPI value (e.g., 100 or 150) provides better resolution and scalability.
Figure Size In addition to DPI scaling, it is important to consider the physical size of the figure. The figsize parameter in the Figure class allows us to specify the width and height of the figure in inches. It is recommended to specify the size using a fixed aspect ratio that maintains consistency across different screen sizes.
Responsive Layout To ensure proper scaling and positioning of the figure within the Tkinter application, we need to utilize Tkinter's layout managers effectively. For example, the pack method used in the code above allows the figure to expand and fill the available space. Alternatively, you can use the grid or place methods based on your specific layout requirements.
Implementing these techniques will enable the figure to adapt and scale appropriately, ensuring a consistent visual representation across various screen resolutions.
Example
Displaying a Scatter Plot Figure Let's consider an example where we display a scatter plot figure to demonstrate screen resolution independence. We will incorporate the techniques discussed above to achieve consistent figure display.
import tkinter as tk
import numpy as np
from matplotlib.figure import Figure
from matplotlib.backends.backend_tkagg import FigureCanvasTkAgg

root = tk.Tk()
root.geometry("700x450")
root.title("Screen Resolution Independent Figures")

# Generate random data
np.random.seed(0)
x = np.random.randn(100)
y = np.random.randn(100)

# Create a Figure and Axis objects
figure = Figure(figsize=(6, 4), dpi=100)
axis = figure.add_subplot(111)

# Plot the scatter plot
axis.scatter(x, y)

# Configure the plot
axis.set_title("Scatter Plot")
axis.set_xlabel("X")
axis.set_ylabel("Y")

# Create the FigureCanvasTkAgg object
canvas = FigureCanvasTkAgg(figure, master=root)
canvas.get_tk_widget().pack()

root.mainloop()
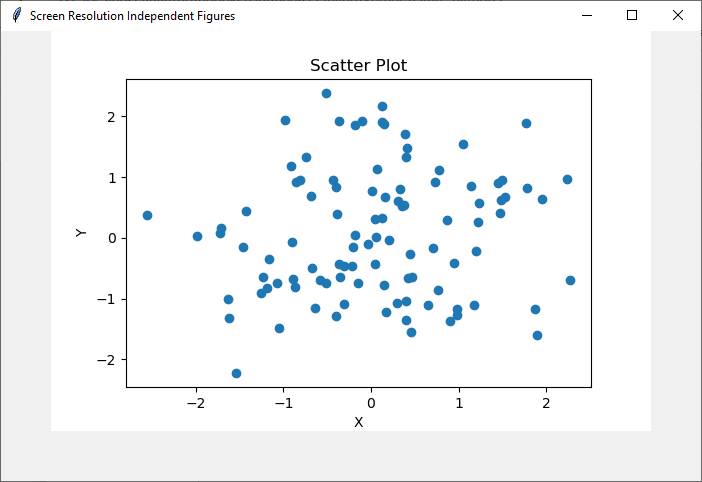
In this example, we generate random data points using NumPy and create a scatter plot using Matplotlib. The figure is then displayed within the Tkinter application. By setting the appropriate DPI, figure size, and utilizing Tkinter's layout managers, the scatter plot figure will appear consistent and independent of the user's screen resolution.
Output
Running the above code will display a window containing the scatter plot figure, generated by using Matplotlib python library, which is consistent and independent of the screen resolution.

Conclusion
Ensuring screen resolution independence is essential for creating reliable and visually consistent data visualization applications using Python's Tkinter and Matplotlib. By implementing techniques such as DPI scaling, specifying figure size, and employing responsive layout management, we can overcome the challenge of varying screen resolutions. This ensures that the figures adapt seamlessly to different devices and screen sizes, providing users with a consistent and accurate representation of the data.
Screen resolution independence enhances the user experience, allowing for clear and understandable visualizations regardless of the device used. By incorporating these practices into Tkinter applications, developers can create robust and user-friendly data visualization solutions that maintain their integrity and effectiveness across a range of screen resolutions, empowering users to make informed decisions based on the visualized data.

