
Article Categories
- All Categories
-
 Data Structure
-
 Networking
-
 RDBMS
RDBMS
-
 Operating System
-
 Java
Java
-
 MS Excel
-
 iOS
iOS
-
 HTML
HTML
-
 CSS
CSS
-
 Android
-
 Python
-
 C Programming
-
 C++
C++
-
 C#
C#
-
 MongoDB
-
 MySQL
MySQL
-
 Javascript
-
 PHP
PHP
-
 Economics & Finance
Selected Reading
How to customize spines of Matplotlib figures?
When we plot a figure in Matplotlib, it creates four spines around the figure, top, left, bottom and right. Spines are nothing but a box surrounded with the pictorial representation of the grid which displays some ticks and tickable axes on left(y) and bottom(x).
Let us see how to customize the spines in a given figure. We will create six figures to see and customize the spines for it.
First import the required libraries for the workbook.
import numpy as np
import matplotlib.pyplot as plt
Let us draw graph for sines,
theta = np.linspace(0, 2*np.pi, 128)
y = np.sin(theta)
fig = plt.figure(figsize=(8,6))
Define the axes with default spines,
ax1 = fig.add_subplot(2, 3, 1)
ax1.plot(theta, np.sin(theta), 'b-*')
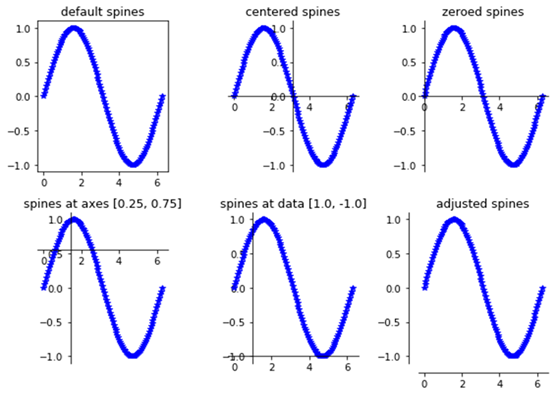
ax1.set_title('default spines')
Define the function to plot the graph,
def plot_graph(axs, title, lposition, bposition):
   ax = fig.add_subplot(axs)
   ax.plot(theta, y, 'b-*')
   ax.set_title(title)
   ax.spines['left'].set_position(lposition)
   ax.spines['right'].set_visible(False)
   ax.spines['bottom'].set_position(bposition)
   ax.spines['top'].set_visible(False)
   ax.xaxis.set_ticks_position('bottom')
   ax.yaxis.set_ticks_position('left')
Let us plot 3 graphs.
plot_graph(232, 'centered spines', 'center', 'center')
plot_graph(233, 'zeroed spines', 'zero', 'zero')
plot_graph(234, 'spines at axes [0.25, 0.75]', ('axes', 0.25),('axes', 0.75))
plot_graph(235, 'spines at data [1.0, -1.0]', ('data', 1.0),('data', -1.0))
plot_graph(236, 'adjusted spines', ('outward', 10), ('outward', 10))
Let us fit the plot in the grid and show.
plt.tight_layout()
plt.show()
Output

Updated on: 2021-02-23T14:48:37+05:30
1K+ Views

Advertisements