- Seaborn - Home
- Seaborn - Introduction
- Seaborn - Environment Setup
- Importing Datasets and Libraries
- Seaborn - Figure Aesthetic
- Seaborn- Color Palette
- Seaborn - Histogram
- Seaborn - Kernel Density Estimates
- Seaborn - Visualizing Pairwise Relationship
- Seaborn - Plotting Categorical Data
- Distribution of Observations
- Seaborn - Statistical Estimation
- Seaborn - Plotting Wide Form Data
- Seaborn - Multi Panel Categorical Plots
- Seaborn - Linear Relationships
- Seaborn - Facet Grid
- Seaborn - Pair Grid
- Seaborn Function Reference
- Seaborn - Function Reference
- Relational Plots
- Distribution Plots
- Categorial plots
- Regression plots
- Matrix Plots
- Multi plot grids
- Themeing
- Color Palettes
- Palette widgets
- Utility Functions
- Seaborn Useful Resources
- Seaborn - Quick Guide
- Seaborn - cheatsheet
- Seaborn - Useful Resources
- Seaborn - Discussion
Seaborn - violinplot() method
The Seaborn.violinplot() method allows the user to draw a box plot along with a kernel density estimate. A violin plot, a box and whisker plot serve the same purpose. In order to allow for comparison, it displays the distribution of quantitative data across a number of levels of one (or more) categorical variables.
The violin plot includes a kernel density estimation of the underlying distribution as opposed to a box plot, in which all of the plot elements correspond to actual data points.
Syntax
Following is the syntax of the violinplot() method −
seaborn.violinplot(*, x=None, y=None, hue=None, data=None, order=None, hue_order=None, bw='scott', cut=2, scale='area', scale_hue=True, gridsize=100, width=0.8, inner='box', split=False, dodge=True, orient=None, linewidth=None, color=None, palette=None, saturation=0.75, ax=None, **kwargs)
Parameters
Some of the parameters of the seaborn.violinplot() method are discussed below.
| S.No | Parameter and Description |
|---|---|
| 1 | x,y These parameters take names of variables as input that plot the long form data. |
| 2 | data This is the dataframe that is used to plot graphs. |
| 3 | hue Names of variables in the dataframe that are needed for plotting the graph. |
| 4 | linewidth This parameter takes floating values and determines the width of the gray lines that frame the elements in the plot. |
| 5 | dodge This parameter takes a boolean value. if we use hue nesting, passing true to this parameter will separate the strips for different hue levels. If False is passed, the points for each level will be plotted on top of each other. |
| 6 | orient It takes values h or v and the orientation of the graph is determined based on this. |
| 7 | color matplotlib color is taken as input and this determines the color of all the elements. |
| 8 | size This parameter determines the radius of the markers in the plot drawn. |
| 9 | palette This parameter is used to set the color palette of the plot. |
| 10 | inner This optional parameter takes the following values. box, quartile, point, stick, None. It is used to represent the data points in the violin interior. |
| 11 | scale This parameter is used to scale the width of each violin. it takes the values, count, width and area. |
| 12 | scale_hue This parameter controls whether the scaling is computed across all violins on the plot or within each level of the major grouping variable when layering violins using a hue variable (scale hue=False). |
| 13 | bw It takes one of the following values, float, "scott," "silverman," and optional The scaling factor to apply for calculating the kernel bandwidth, or the name of a reference rule. The scaling factor multiplied by the standard deviation of the data within each bin will yield the actual kernel size. |
Loading the seaborn library
Let us load the seaborn library and the dataset before moving on to developing the plots. To load or import the seaborn library the following line of code can be used.
Import seaborn as sns
Loading the dataset
In this article, we will make use of the Titanic dataset inbuilt in the seaborn library. the following command is used to load the dataset.
titanic=sns.load_dataset("titanic")
The below mentioned command is used to view the first 5 rows in the dataset. This enables us to understand what variables can be used to plot a graph.
titanic.head()
The below is the output for the above piece of code.
index,survived,pclass,sex,age,sibsp,parch,fare,embarked,class,who,adult_male,deck,embark_town,alive,alone
0,0,3,male,22.0,1,0,7.25,S,Third,man,true,NaN,Southampton,no,false
1,1,1,female,38.0,1,0,71.2833,C,First,woman,false,C,Cherbourg,yes,false
2,1,3,female,26.0,0,0,7.925,S,Third,woman,false,NaN,Southampton,yes,true
Now that we have loaded the dataset, we will explore a few examples.
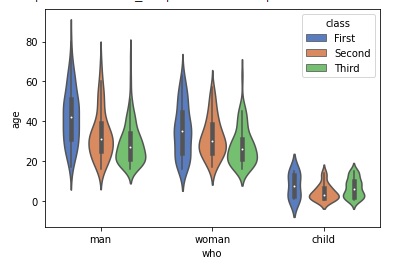
Example 1
In this example, we will see how to use the seaborn.violinplot() method. We will pass x,y,hue and palette parameters to the method and then we will observe the plot being drawn. We are using the in-built titanic dataset in this article. The below line of code uses the x,y,hue and palette parameters of the violin plot method.
import seaborn as sns
import matplotlib.pyplot as plt
titanic=sns.load_dataset("titanic")
titanic.head()
sns.violinplot(x="who", y="age", data=titanic,hue="class",palette="muted")
plt.show()
Output
The output plot produced is as follows −
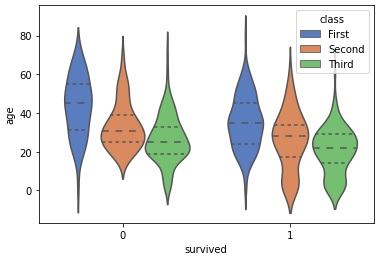
Example 2
In this example, we will understand the usage of the inner parameter. This optional parameter takes the following values. box, quartile, point, stick, None. It is used to represent the data points in the violin interior. The following line of code can be used to understand the usage of the inner parameter.
import seaborn as sns
import matplotlib.pyplot as plt
titanic=sns.load_dataset("titanic")
titanic.head()
sns.violinplot(x="survived", y="age", data=titanic,hue="class",palette="muted",inner="quartile")
plt.show()
Output
The output of the above line of code is as follows −
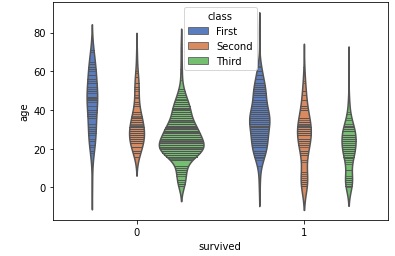
Example 3
There are many parameters in the violinplot() method. We will understand how to use the scale and scale hue parameter. The scale parameter is used to scale the width of each violin. it takes the values, count, width and area. The scale_hue parameter controls whether the scaling is computed across all violins on the plot or within each level of the major grouping variable when layering violins using a hue variable (scale hue=False). These parameters along with the above mentioned parameters are depicted in this example.
import seaborn as sns
import matplotlib.pyplot as plt
titanic=sns.load_dataset("titanic")
titanic.head()
sns.violinplot(x="survived", y="age", data=titanic,hue="class",palette="muted",inner="stick",scale="count",scale_hue=False)
plt.show()
Output
the output of the above code snippet is as follows −
Example 4
We will use the bw parameter in this example along with all the other parameters. It takes one of the following values, float, "scott," "silverman," and optional. The scaling factor to apply for calculating the kernel bandwidth, or the name of a reference rule. The scaling factor multiplied by the standard deviation of the data within each bin will yield the actual kernel size. The following line of code can be used to do so.
#bw is used to narrow bandwith to reduce smoothing
import seaborn as sns
import matplotlib.pyplot as plt
titanic=sns.load_dataset("titanic")
titanic.head()
sns.violinplot(x="survived", y="age", data=titanic,hue="class",palette="muted",inner="quartile",scale="count",bw=.2)
plt.show()
Output
The output for the above code is displayed below.
_method.jpg)
