- Seaborn - Home
- Seaborn - Introduction
- Seaborn - Environment Setup
- Importing Datasets and Libraries
- Seaborn - Figure Aesthetic
- Seaborn- Color Palette
- Seaborn - Histogram
- Seaborn - Kernel Density Estimates
- Seaborn - Visualizing Pairwise Relationship
- Seaborn - Plotting Categorical Data
- Distribution of Observations
- Seaborn - Statistical Estimation
- Seaborn - Plotting Wide Form Data
- Seaborn - Multi Panel Categorical Plots
- Seaborn - Linear Relationships
- Seaborn - Facet Grid
- Seaborn - Pair Grid
- Seaborn Function Reference
- Seaborn - Function Reference
- Relational Plots
- Distribution Plots
- Categorial plots
- Regression plots
- Matrix Plots
- Multi plot grids
- Themeing
- Color Palettes
- Palette widgets
- Utility Functions
- Seaborn Useful Resources
- Seaborn - Quick Guide
- Seaborn - cheatsheet
- Seaborn - Useful Resources
- Seaborn - Discussion
Seaborn.set_palette() method
Seaborn.set_palette() method is used to set the palette for plots. The one use of this method is to set the palette for the plots visualized later. Using a seaborn palette, this method sets the matplotlib color cycle.
Syntax
Following is the syntax of the seaborn.set_palette() method −
seaborn.set_palette(palette, n_colors=None, desat=None, color_codes=False)
Parameters
The parameters of the seaborn.set_palette() method are described below.
| S.No | Parameter and Description |
|---|---|
| 1 | Palette The palette that is to be set. |
| 2 | n_colors Number of colors in the cycle. |
| 3 | Desat Proportion to desaturase each color by |
| 4 | Color_codes Takes Booleans values and remaps the shorthand color codes (such as "b," "g," "r," etc.) to the colours from this palette if True is passed. |
Loading the seaborn library
Let us load the seaborn library and the dataset before moving on to developing the plots.. To load or import the seaborn library the following line of code can be used.
Import seaborn as sns
Loading the dataset
In this article, we will make use of the Titanic dataset inbuilt in the seaborn library. the following command is used to load the dataset.
titanic=sns.load_dataset("titanic")
The below mentioned command is used to view the first 5 rows in the dataset. This enables us to understand what variables can be used to plot a graph.
titanic.head()
The below is the output for the above piece of code.
index,survived,pclass,sex,age,sibsp,parch,fare,embarked,class,who,adult_male,deck,embark_town,alive,alone
0,0,3,male,22.0,1,0,7.25,S,Third,man,true,NaN,Southampton,no,false
1,1,1,female,38.0,1,0,71.2833,C,First,woman,false,C,Cherbourg,yes,false
2,1,3,female,26.0,0,0,7.925,S,Third,woman,false,NaN,Southampton,yes,true
Now that we have loaded the dataset, we will explore as few examples.
The set palette method like mentioned above is used to set the color palette for the following plots and it takes different values some of the values are as follows −
{'Accent', 'Accent_r', 'Blues', 'Blues_r', 'BrBG', 'BrBG_r', 'BuGn', 'BuGn_r', 'BuPu', 'BuPu_r', 'CMRmap', 'CMRmap_r', 'Dark2', 'Dark2_r', 'GnBu', 'GnBu_r', 'Greens', 'Greens_r', 'Greys', 'Greys_r', 'OrRd', 'OrRd_r', 'Oranges', 'Oranges_r', 'PRGn', 'PRGn_r', 'Paired', 'Paired_r', 'Pastel1', 'Pastel1_r', 'Pastel2', 'Pastel2_r', 'PiYG'}
The below examples depict the usage of the seaborn.set_palette() method.
Example 1
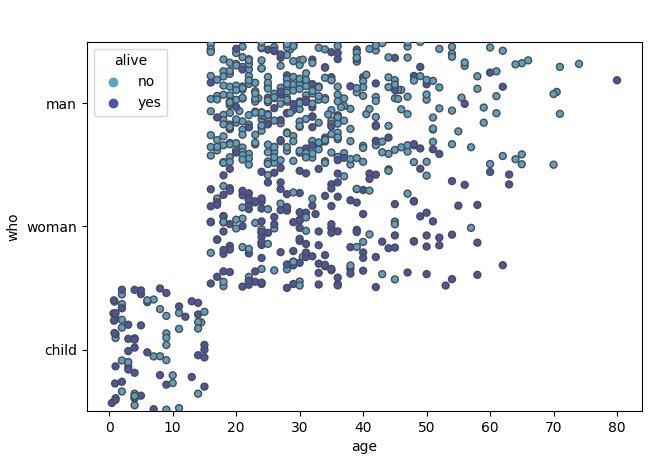
In the below example, we will pass ice fire as the color palette to the set_palette() method and draw a plot to see the color palette.
import seaborn as sns
import matplotlib.pyplot as plt
titanic=sns.load_dataset("titanic")
titanic.head()
sns.set_palette("icefire")
plt.show()
Next, we will draw a plot to see the color palette that is set. In this example we will use the stripplot() method and use the titanic dataset in-built in the seaborn library.
import seaborn as sns
import matplotlib.pyplot as plt
titanic=sns.load_dataset("titanic")
titanic.head()
sns.stripplot(x="age", y="who", hue="alive",data=titanic,jitter=0.5,linewidth=1)
plt.show()
Output
Example 2
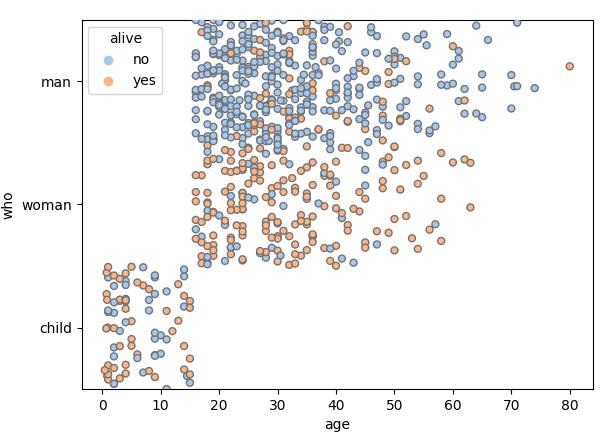
In this example, we will see the working of another color palette that is a part of the set.
import seaborn as sns
import matplotlib.pyplot as plt
titanic=sns.load_dataset("titanic")
titanic.head()
sns.set_palette("pastel")
sns.stripplot(x="age", y="who", hue="alive",data=titanic,jitter=0.5,linewidth=1)
plt.show()
The above code contains the following palette of colors for the palette name passed.

Output
The output of the above example is as follows −
Example 3
In this example, we will see another matplotlib palette by simply passing it as an argument to the set_palette() method.
import seaborn as sns
import matplotlib.pyplot as plt
titanic=sns.load_dataset("titanic")
titanic.head()
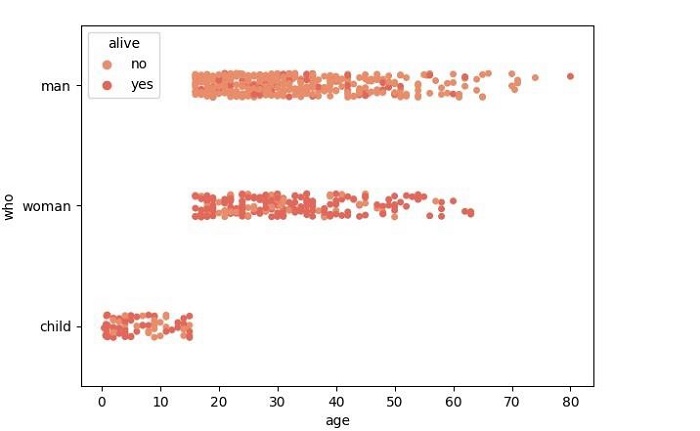
sns.set_palette("flare")
plt.show()
The above line of code will contain the following series of colors that are part of the palette and the plots produced later will contain similar colors.

Say the following code is used to produce a plot, the plot shown below will be obtained and as observed it contains same colors as shown in the pantone above.
import seaborn as sns
import matplotlib.pyplot as plt
titanic=sns.load_dataset("titanic")
titanic.head()
sns.stripplot(x="age", y="who", hue="alive",data=titanic)
plt.show()
Output
The output plot produced is as follows −