- Seaborn - Home
- Seaborn - Introduction
- Seaborn - Environment Setup
- Importing Datasets and Libraries
- Seaborn - Figure Aesthetic
- Seaborn- Color Palette
- Seaborn - Histogram
- Seaborn - Kernel Density Estimates
- Seaborn - Visualizing Pairwise Relationship
- Seaborn - Plotting Categorical Data
- Distribution of Observations
- Seaborn - Statistical Estimation
- Seaborn - Plotting Wide Form Data
- Seaborn - Multi Panel Categorical Plots
- Seaborn - Linear Relationships
- Seaborn - Facet Grid
- Seaborn - Pair Grid
- Seaborn Function Reference
- Seaborn - Function Reference
- Relational Plots
- Distribution Plots
- Categorial plots
- Regression plots
- Matrix Plots
- Multi plot grids
- Themeing
- Color Palettes
- Palette widgets
- Utility Functions
- Seaborn Useful Resources
- Seaborn - Quick Guide
- Seaborn - cheatsheet
- Seaborn - Useful Resources
- Seaborn - Discussion
Seaborn.desaturate() method
The Seaborn.desaturate() method is used to de saturate a color by some percentage and then this de saturated color is returned.
What is desaturation? Desaturation of a color is a process of making a color more muted by adding pigments of various colors, quite commonly black or white. These newly muted colors appear close to the greyscale and less vivid than saturated colors.
Syntax
Following is the syntax of the seaborn.desaturate() method −
seaborn.desaturate(color,prop)
Parameters
The parameters of this seaborn.saturate() method are given below.
| S.No | Parameter and Description |
|---|---|
| 1 | color This parameter takes matplotlib color as input and the values include hex, rgb-tuple or an html color name. |
| 2 | prop Floating values that describes the amount ot desaturate the color by. |
Return Value
The return value of this method is an RGB-tuple which contains the de-saturated color of the color passed.
Example 1
Now we will see how the method works by passing a color to it.
import seaborn as sns
import matplotlib.pyplot as plt
titanic=sns.load_dataset("titanic")
titanic.head()
sns.saturate("pink"",0.9)
plt.show()
Output
The output produced is as follows. An rgb tuple of the color after desaturation is given as output.
(0.9876470588235293, 0.7652941176470589, 0.8041176470588234)
Example 2
In this example we will de saturate another color and obtain the saturated color. We can use the palplot() method to visualize the RGB tuples sent by the saturate method.
The following line of code can be used to do so −
import seaborn as sns
import matplotlib.pyplot as plt
titanic=sns.load_dataset("titanic")
titanic.head()
sns.palplot(sns.desaturate("blue",0.5))
plt.show()
Output
The output is as follows,

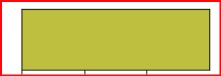
Example 3
We will use the palplot() method to visualize a color saturated using the saturate method. The below line of code can be used to do so.
import seaborn as sns
import matplotlib.pyplot as plt
titanic=sns.load_dataset("titanic")
titanic.head()
sns.palplot(sns.desaturate("yellow",0.5))
plt.show()
Output
The output is as follows −