- Seaborn - Home
- Seaborn - Introduction
- Seaborn - Environment Setup
- Importing Datasets and Libraries
- Seaborn - Figure Aesthetic
- Seaborn- Color Palette
- Seaborn - Histogram
- Seaborn - Kernel Density Estimates
- Seaborn - Visualizing Pairwise Relationship
- Seaborn - Plotting Categorical Data
- Distribution of Observations
- Seaborn - Statistical Estimation
- Seaborn - Plotting Wide Form Data
- Seaborn - Multi Panel Categorical Plots
- Seaborn - Linear Relationships
- Seaborn - Facet Grid
- Seaborn - Pair Grid
- Seaborn Function Reference
- Seaborn - Function Reference
- Relational Plots
- Distribution Plots
- Categorial plots
- Regression plots
- Matrix Plots
- Multi plot grids
- Themeing
- Color Palettes
- Palette widgets
- Utility Functions
- Seaborn Useful Resources
- Seaborn - Quick Guide
- Seaborn - cheatsheet
- Seaborn - Useful Resources
- Seaborn - Discussion
Seaborn.cubehelix_palette() method
The Seaborn.cubehelix_palette() method is used to make a sequential palette from cubehelix system.
This method also produces a colormap with linearly changing (increasing or decreasing) lightness. That means, whenever the color information is printed to black and white or is viewed by someone who is colorblind, the information is automatically preserved. The user gains more control over the cubehelix_palette() function in the matplotlib with a different set of defaults.
We can either use the already existing cubehelix palette or generate one using the seaborn library.
Syntax
Following is the syntax of the cubehelix_palette() method −
seaborn.cubehelix_palette(n_colors=6, start=0, rot=0.4, gamma=1.0, hue=0.8, light=0.85, dark=0.15, reverse=False, as_cmap=False)
Parameters
The parameters of the cubehelix method are described below.
| S.No | Parameter and Description |
|---|---|
| 1 | n_colors Number of colors in the cycle. |
| 2 | start The hue at the start of the helix. This values lies between 0 and 3. |
| 3 | rot Takes floating point values and it is the value of rotations around the hue wheel over the range of the palette. |
| 4 | hue takes floating point values and lies between 0 and 1. It is the saturation of the colors. |
| 5 | gamma Takes floating point values and it emphasizes darker or lighter colors. |
| 6 | dark Takes floating point values and intensity of the darkest color in the palette. |
| 7 | light Takes floating point and it sets the intensity of the lightest color in the palette. |
| 8 | reverse Takes Boolean values and if true the paletee colors will go from dark to light. |
| 9 | as_cmap() Takes Boolean and returns a matplotlib colormap. |
Return value
This method returns a list of RGB tuples or an matplotlib colormap.
Example 1
In this example, we will see how to use the cubehelix method works. We will not pass any arguments to it and the default palette will be displayed.
import seaborn as sns
import matplotlib.pyplot as plt
titanic=sns.load_dataset("titanic")
titanic.head()
sns.palplot(sns.cubehelix_palette())
plt.show()
Output
the output is as follows,
Example 2
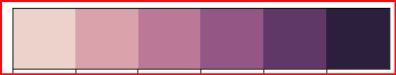
In this example, we will pass the rot value to the cubehelix_palette() method. The rot parameter takes floating point values and it is the value of rotations around the hue wheel over the range of a palette.
import seaborn as sns
import matplotlib.pyplot as plt
titanic=sns.load_dataset("titanic")
titanic.head()
sns.palplot(sns.cubehelix_palette(rot=0.7))
plt.show()
Output
the output obtained is a matplotlib colormap and it can be seen below.
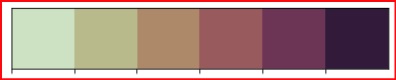
The rot parameter can take negative values too. In the below example, we will see how different palette is produced when the value passed to rot is negative.
import seaborn as sns
import matplotlib.pyplot as plt
titanic=sns.load_dataset("titanic")
titanic.head()
sns.palplot(sns.cubehelix_palette(rot=-0.2))
plt.show()
Output
the output produced is as follows,

Example 3
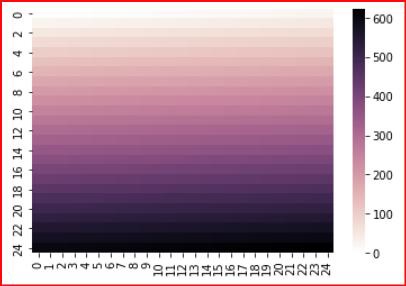
Here, we will see how to generate a colormap using the custom color palette created by this method. To generate a heatmap, we will need to use the heatmap function and to do so, the following line of code can be used. Here, the light is set to 1 which indicates that the intensity of the lightest color in the palette. Since, as_cmap is passed a True value, a color map is generated and this is stored in cmap. This cmap along with range stored in x variable is passed to the heatmap and the following heatmap is generated.
import seaborn as sns
import matplotlib.pyplot as plt
titanic=sns.load_dataset("titanic")
titanic.head()
from numpy import arange
x = arange(625).reshape(25, 25)
cmap = sns.cubehelix_palette(dark=0, light=1, as_cmap=True)
ax = sns.heatmap(x, cmap=cmap)
plt.show()
Output
The output for the above line of code is as follows −