- Seaborn - Home
- Seaborn - Introduction
- Seaborn - Environment Setup
- Importing Datasets and Libraries
- Seaborn - Figure Aesthetic
- Seaborn- Color Palette
- Seaborn - Histogram
- Seaborn - Kernel Density Estimates
- Seaborn - Visualizing Pairwise Relationship
- Seaborn - Plotting Categorical Data
- Distribution of Observations
- Seaborn - Statistical Estimation
- Seaborn - Plotting Wide Form Data
- Seaborn - Multi Panel Categorical Plots
- Seaborn - Linear Relationships
- Seaborn - Facet Grid
- Seaborn - Pair Grid
- Seaborn Function Reference
- Seaborn - Function Reference
- Relational Plots
- Distribution Plots
- Categorial plots
- Regression plots
- Matrix Plots
- Multi plot grids
- Themeing
- Color Palettes
- Palette widgets
- Utility Functions
- Seaborn Useful Resources
- Seaborn - Quick Guide
- Seaborn - cheatsheet
- Seaborn - Useful Resources
- Seaborn - Discussion
Seaborn.choose_cubehelix_palette() method
The Seaborn.choose_cubehelix_palette() method is used to enable widgets to choose colors in the cubehelix palette.
This method goes hand in hand with the cubehelix_palette() method.This palette works better for the data that falls in the range of uninteresting low values to interesting higher values. Due to the cubehelix system, distinguishing wider range of values is easier as the hue variance across the range is relatively more.
Note − The method required IPython 2+ version and must be executed in the notebook.
Syntax
Following is the syntax of the seaborn.choose_cubehelix_palette() method −
seaborn.choose_cubehelix_palette(as_cmap=False)
Parameters
This method accepts a single parameter as_cmap
| S.No | Parameter and Description |
|---|---|
| 1 | as_cmap This optional parameter takes Boolean values and if true returns an matplotlib colormap. |
Return Value
This method returns a pal or cmap that is a list of colors or a matplotlib colormap. The method can be understood in the examples given below.
Example 1
The usage of this method that enables the user to use a cubelhelix palette in a widget form for easier access is as follows.
The below line of code is used to enable the widget.
sns.choose_cubehelix_palette(as_cmap=False)
Output
The output is as follows −
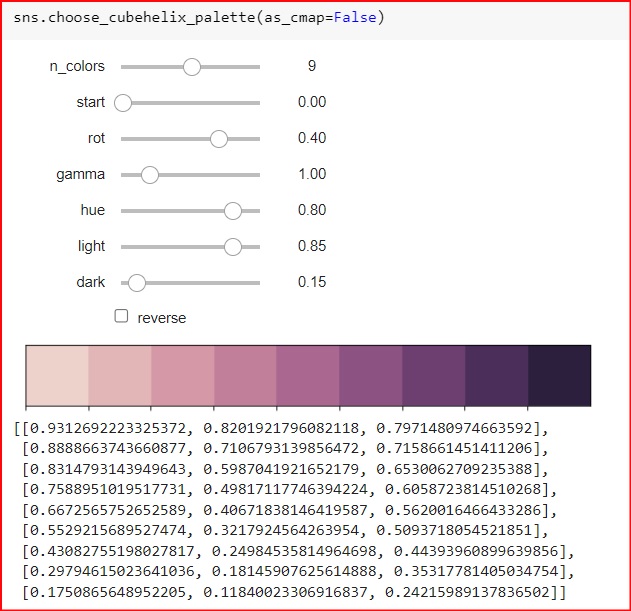
In this widget there are multiple options and it mainly has two versions such as the regular version displayed in the image above and the reverse mode displayed below.
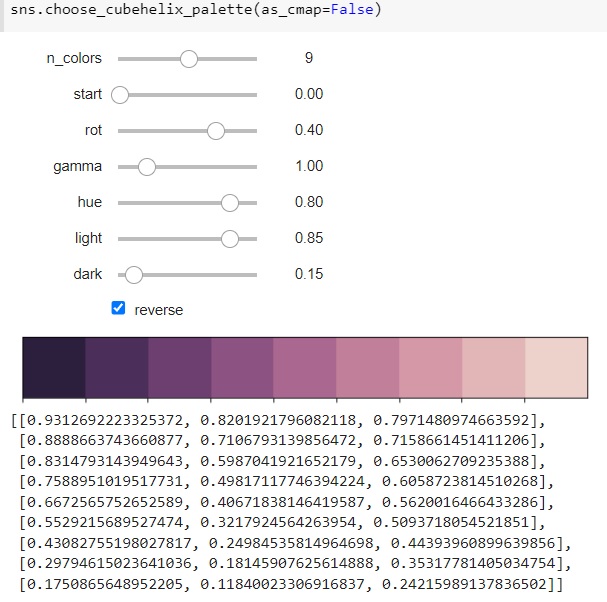
There are progress bars for the number of colors, saturation of the colors, rotaton of the colors, gamma variations of the colors, changing hue of the palette, changing the lightness and darkness of the colors in the palette. All of these progress bars can be toned up and down to change the palette according to use and later can be used to plot graphs.
