- Seaborn - Home
- Seaborn - Introduction
- Seaborn - Environment Setup
- Importing Datasets and Libraries
- Seaborn - Figure Aesthetic
- Seaborn- Color Palette
- Seaborn - Histogram
- Seaborn - Kernel Density Estimates
- Seaborn - Visualizing Pairwise Relationship
- Seaborn - Plotting Categorical Data
- Distribution of Observations
- Seaborn - Statistical Estimation
- Seaborn - Plotting Wide Form Data
- Seaborn - Multi Panel Categorical Plots
- Seaborn - Linear Relationships
- Seaborn - Facet Grid
- Seaborn - Pair Grid
- Seaborn Function Reference
- Seaborn - Function Reference
- Relational Plots
- Distribution Plots
- Categorial plots
- Regression plots
- Matrix Plots
- Multi plot grids
- Themeing
- Color Palettes
- Palette widgets
- Utility Functions
- Seaborn Useful Resources
- Seaborn - Quick Guide
- Seaborn - cheatsheet
- Seaborn - Useful Resources
- Seaborn - Discussion
Seaborn.choose_colorbrewer_palette()
Seaborn.chooose_colorbrewer_palette() method is a palette widget that enables the user to choose colors present in the given options. This is very useful and a creative way to enable the user to choose colors.
These palettes are built-in matplotlib palettes and they can be accessed by name in many seaborn functions. They can also be used by passing the object returned by this function.
Syntax
Following is the syntax of the choose_colorbrewer_palette() −
seaborn.choose_colorbrewer_palette(data_type, as_cmap=False)
Parameters
The parameters of this method are shown below.
| S.No | Parameter and Description |
|---|---|
| 1 | Datatype Takes values from qualitative, diverging and sequential. The type of data you want to visualize is described by this. You should be aware that you can pass substrings, such as 'q' for 'qualitative. |
| 2 | As_cmap This optional parameter takes Boolean values and if true returns an matplotlib colormap. |
Return Value
This method returns a pal or cmap that is a list of colors or a matplotlib colormap. The method can be understood in the examples given below.
Example 1
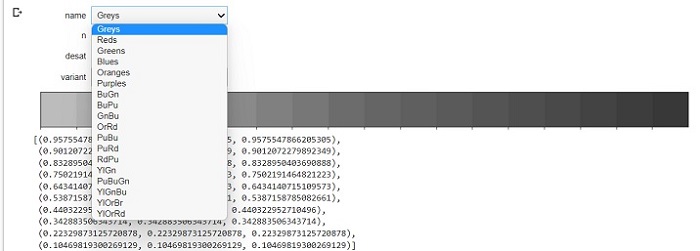
In this example, we will see how the sequential datatype will work and all the options it offers. The following line of code can be used to use a sequential palette widget.
sns.choose_colorbrewer_palette("sequential", as_cmap=False)
Output
The output is as follows −
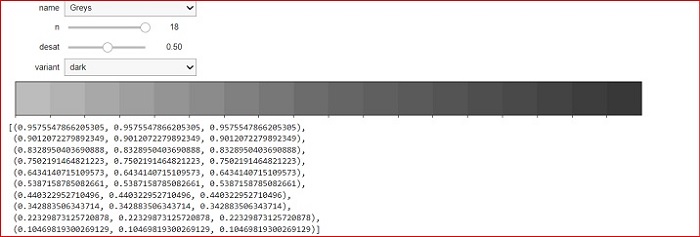
The different names available are −
The different variants available are −
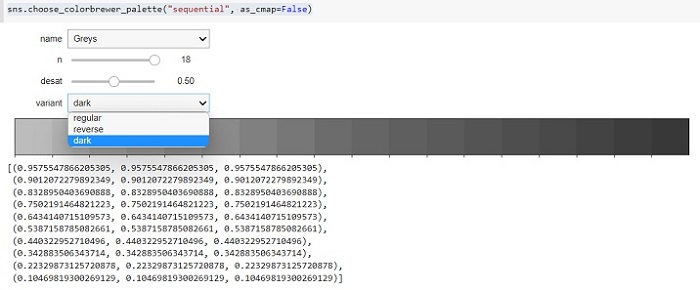
The reverse will change the color order from dark to light or vice versa and the dark will change the colors from light to dark as they progress.
Example 2
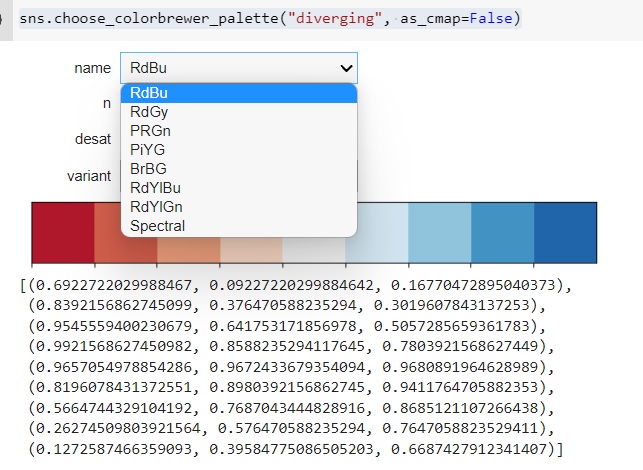
In this example, we will see how the diverging data tile will work and all the options it offers. The following line of code can be used to use a sequential palette widget.
sns.choose_colorbrewer_palette("diverging", as_cmap=False)
Output
The output is as follows −
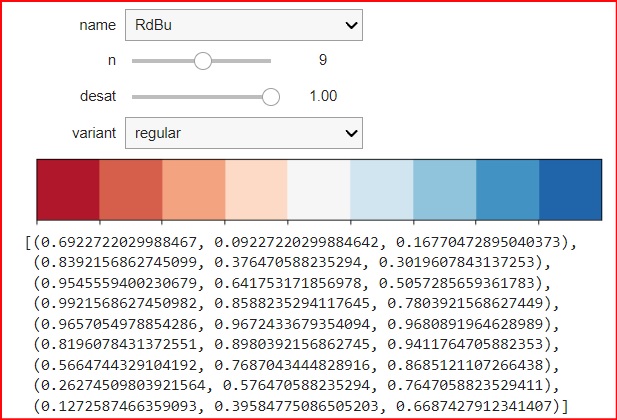
The different names available are −
The different variants available are −
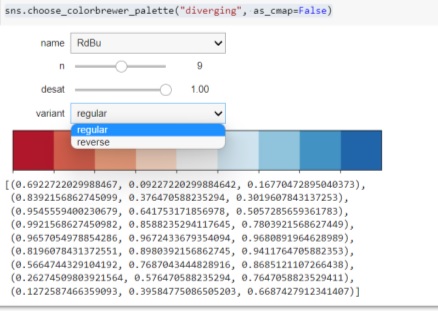
The reverse will change the color order from dark to light or vice versa and the regular is the normal order.
Example 3
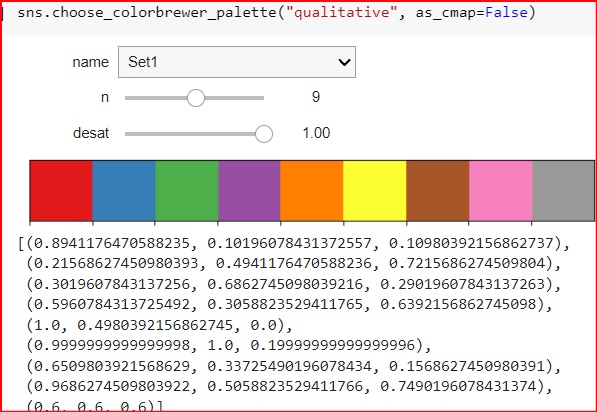
In this example, we will see how the qualitative data tile will work and all the options it offers. The following line of code can be used to use a sequential palette widget.
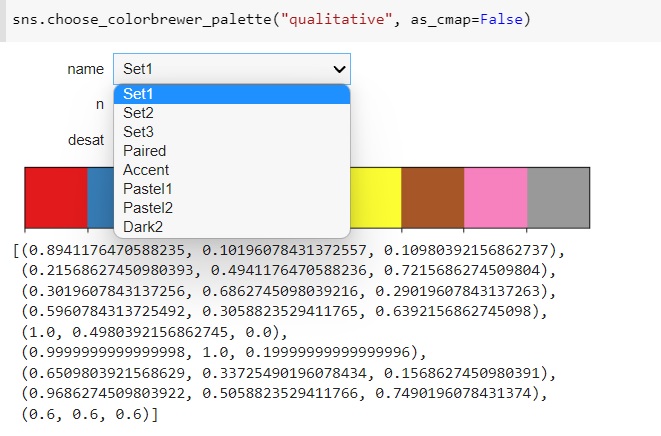
sns.choose_colorbrewer_palette("qualitative", as_cmap=False)
Output
the output is as follows,
The different names available are,
In all these examples, n depicts the number of colors to be shown in the color map and dataset is the desaturation of the colors.
