- Seaborn - Home
- Seaborn - Introduction
- Seaborn - Environment Setup
- Importing Datasets and Libraries
- Seaborn - Figure Aesthetic
- Seaborn- Color Palette
- Seaborn - Histogram
- Seaborn - Kernel Density Estimates
- Seaborn - Visualizing Pairwise Relationship
- Seaborn - Plotting Categorical Data
- Distribution of Observations
- Seaborn - Statistical Estimation
- Seaborn - Plotting Wide Form Data
- Seaborn - Multi Panel Categorical Plots
- Seaborn - Linear Relationships
- Seaborn - Facet Grid
- Seaborn - Pair Grid
- Seaborn Function Reference
- Seaborn - Function Reference
- Relational Plots
- Distribution Plots
- Categorial plots
- Regression plots
- Matrix Plots
- Multi plot grids
- Themeing
- Color Palettes
- Palette widgets
- Utility Functions
- Seaborn Useful Resources
- Seaborn - Quick Guide
- Seaborn - cheatsheet
- Seaborn - Useful Resources
- Seaborn - Discussion
Seaborn.axes_style() method
The Seaborn.axes_style() method is used to obtain the settings that govern the plots' overall look.
This is done by making the style parameters control various properties the color of the background and whether a grid is enabled by default, which is carried out using the matplotlib rcParams system.
The axes_style() method can also be used to alter the global defaults temporarily.
Syntax
Following is the syntax of seaborn.axes_styles() method −
seaborn.axes_style(style=None, rc=None)
Parameters
Following is the list of parameters of this method −
| S.No | Parameter and Description |
|---|---|
| 1 | Style Takes values, None, dict, or one of {darkgrid, whitegrid, dark, white, ticks} and determines a dictionary of parameters or the name of a preconfigured style. |
| 2 | Rc Takes rcdict as value and is an optional parameter that performs Parameter mappings to override the values in the preset seaborn style dictionaries. This only updates parameter that are considered part of the style definition. |
Now we will move onto understanding this method with the use of examples.
Example 1
Firstly, just calling the function will generate a list of current defaults for all the style parameters. As we can see in the output a list of all the defaults is generated.
import seaborn as sns
import matplotlib.pyplot as plt
tips=sns.load_dataset("tips")
tips.head()
sns.axes_style()
plt.show()
Output
The output obtained is −
{'axes.axisbelow': True, 'axes.edgecolor': '.15', 'axes.facecolor': 'white', 'axes.grid': False, 'axes.labelcolor': '.15', 'axes.spines.bottom': True, 'axes.spines.left': True, 'axes.spines.right': True, 'axes.spines.top': True, 'figure.facecolor': 'white', 'font.family': ['sans-serif'], 'font.sans-serif': ['Arial', 'DejaVu Sans', 'Liberation Sans', 'Bitstream Vera Sans', 'sans-serif'], 'grid.color': '.8', 'grid.linestyle': '-', 'image.cmap': 'rocket', 'lines.solid_capstyle': 'round', 'patch.edgecolor': 'w', 'patch.force_edgecolor': True, 'text.color': '.15', 'xtick.bottom': True, 'xtick.color': '.15', 'xtick.direction': 'out', 'xtick.top': False, 'ytick.color': '.15', 'ytick.direction': 'out', 'ytick.left': True, 'ytick.right': False}
Example 2
Next, we try by calling the name of a predefined style will show the defaults for the style.
In this case, we will call the white style and see the values.
import seaborn as sns
import matplotlib.pyplot as plt
tips=sns.load_dataset("tips")
tips.head()
sns.axes_style("white")
plt.show()
Output
The output obtained is −
{'axes.axisbelow': True, 'axes.edgecolor': '.15', 'axes.facecolor': 'white', 'axes.grid': False, 'axes.labelcolor': '.15', 'axes.spines.bottom': True, 'axes.spines.left': True, 'axes.spines.right': True, 'axes.spines.top': True, 'figure.facecolor': 'white', 'font.family': ['sans-serif'], 'font.sans-serif': ['Arial', 'DejaVu Sans', 'Liberation Sans', 'Bitstream Vera Sans', 'sans-serif'], 'grid.color': '.8', 'grid.linestyle': '-', 'image.cmap': 'rocket', 'lines.solid_capstyle': 'round', 'patch.edgecolor': 'w', 'patch.force_edgecolor': True, 'text.color': '.15', 'xtick.bottom': False, 'xtick.color': '.15', 'xtick.direction': 'out', 'xtick.top': False, 'ytick.color': '.15', 'ytick.direction': 'out', 'ytick.left': False, 'ytick.right': False}
Example 3
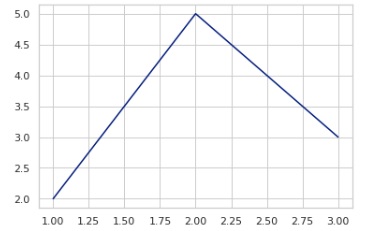
Now, we will try to plot a graph by setting the axes_styles.a line plot is plotted in the below example.
import seaborn as sns
import matplotlib.pyplot as plt
tips=sns.load_dataset("tips")
tips.head()
with sns.axes_style("whitegrid"):
sns.lineplot(x=[1, 2, 3], y=[2, 5, 3])
plt.show()
Output
The output obtained is as follows −