 Data Structure
 Networking
 RDBMS
RDBMS Operating System
 Java
Java MS Excel
 iOS
iOS HTML
HTML CSS
CSS Android
 Python
 C Programming
 C++
C++ C#
C# MongoDB
 MySQL
MySQL Javascript
 PHP
PHP
- Selected Reading
- UPSC IAS Exams Notes
- Developer's Best Practices
- Questions and Answers
- Effective Resume Writing
- HR Interview Questions
- Computer Glossary
- Who is Who
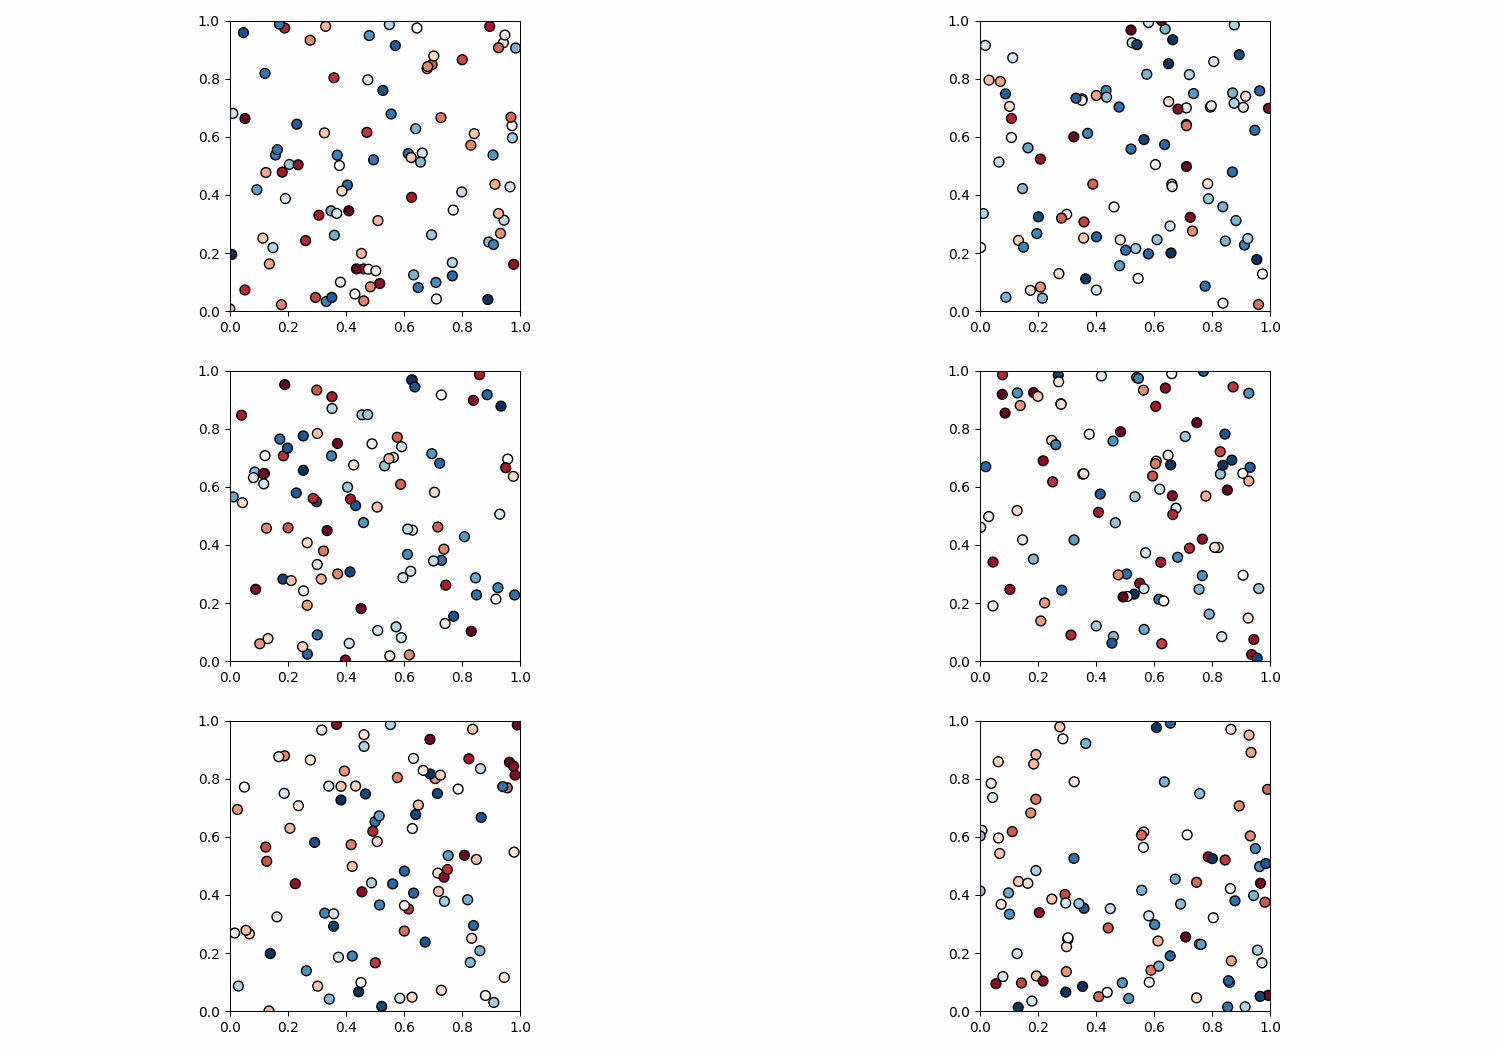
Saving scatterplot animations with matplotlib
To save scatterplot animations with matplotlib, we can take the following steps −
- Set the figure size and adjust the padding between and around the subplots.
- Initialize four variables, steps, nodes, positions and solutions.
- Append positions and solutions values in the list.
- Create a figure and a set of subplots.
- Initialize a variable for marker size.
- Configure the grid lines.
- Make an animation by repeatedly calling a function *animate*, to clear the axis, add new axis sublot, and plot scatter points on the axis.
- Save the animated scatter plot as a .gif file.
Example
import matplotlib.pyplot as plt
import matplotlib.animation as animation
import numpy as np

plt.rcParams["figure.figsize"] = [7.50, 3.50]
plt.rcParams["figure.autolayout"] = True

steps = 50
nodes = 100
positions = []
solutions = []

for i in range(steps):
   positions.append(np.random.rand(2, nodes))
   solutions.append(np.random.random(nodes))

fig, ax = plt.subplots()
   marker_size = 50

def animate(i):
   fig.clear()
   ax = fig.add_subplot(111, aspect='equal', autoscale_on=False, xlim=(0, 1), ylim=(0, 1))
   ax.set_xlim(0, 1)
   ax.set_ylim(0, 1)
   s = ax.scatter(positions[i][0], positions[i][1], s=marker_size, c=solutions[i], cmap="RdBu_r", marker="o", edgecolor='black')

plt.grid(b=None)
ani = animation.FuncAnimation(fig, animate, interval=100, frames=range(steps))

ani.save('animation.gif', writer='pillow')
Output


Advertisements
