- QC - Home
- QC - Introduction
- QC - Environment Setup
- QC - Server Side Configurations
- QC - Common Functionalities
- QC - Management
- QC - Requirements
- QC - Test Plan
- QC - Test Lab
- QTP - QC Integration
- QC - Defects
- QC - Dashboard Analysis
- QC - Project Customization
Quality Center - Dashboard Analysis
Dashboard Tab contains "Analysis View" and "Dashboard View" enabling user to analyze and display ALM data in various formats. Let us understand the importance of each one of them in detail.
Analysis View − It Contains the analysis tree using which project managers/QA can organize all of their analysis items which can be any one of the following viz. graphs, project reports, and Excel reports.
Dashboard View − It Contains the dashboard tree in which managers/testers organize dashboard pages that can arrange multiple graphs that was created in the analysis tree, and display them in a single view.
Analysis View
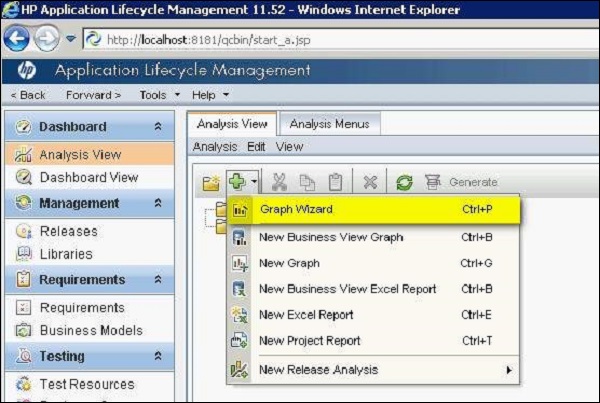
Step 1 − Go to "Analysis View" and click on "+" button and select "Graph wizard". The "Graph Wizard" dialog opens.
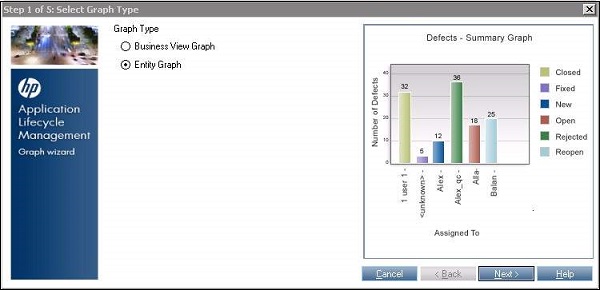
Step 2 − Select "Entity Graph" and click "Next" as shown below.
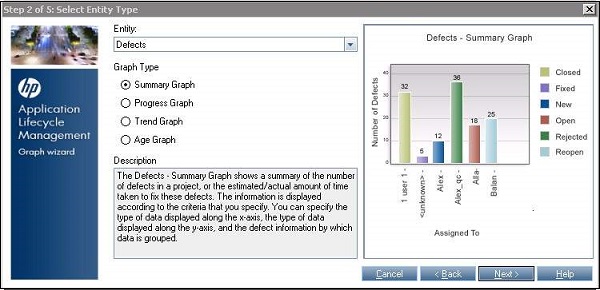
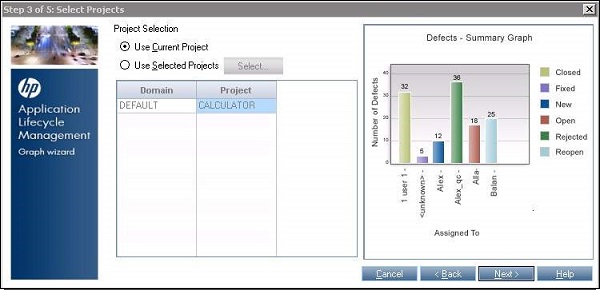
Step 3 − Select the kind of Entity(Defects, Test Case, runs, Test Configuration) against which the graph needs to be generated.
Step 4 − One can choose all projects that they have got access to or they can choose just the current project.
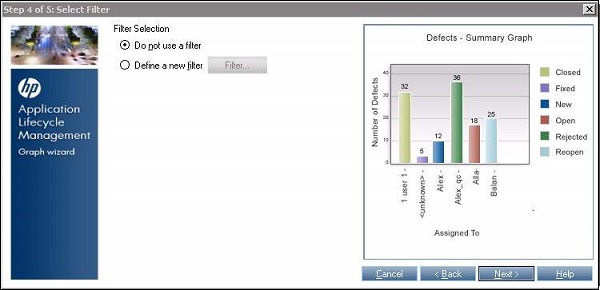
Step 5 − One can filter based on release/cycle and ensure that only the relevant data is displayed.
Step 6 − We can also "group by" based on a particular field and choose what needs to be mapped against X-Axis.
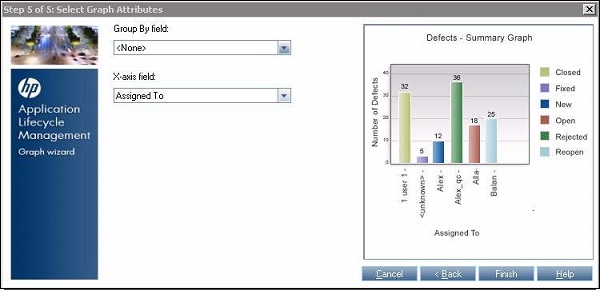
Step 7 − Once the Finish button is clicked, the graph is generated based on the users choice/settings.
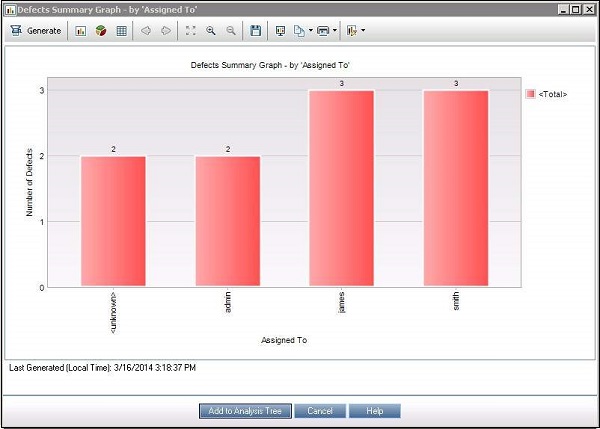
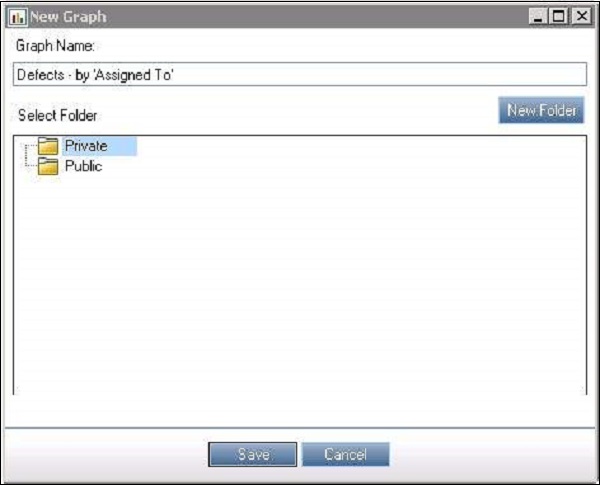
Step 8 − The generated graph can be named and saved either as public or private.
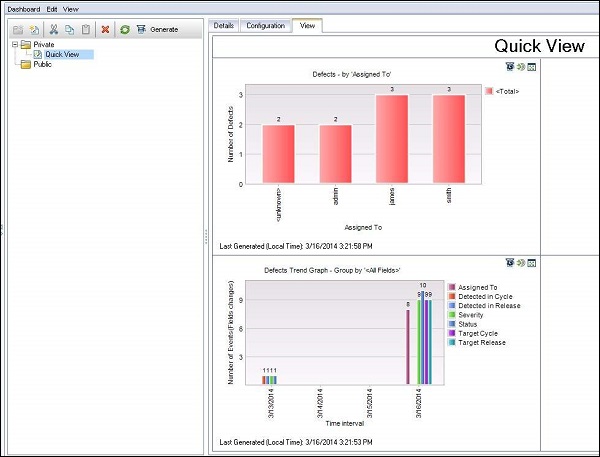
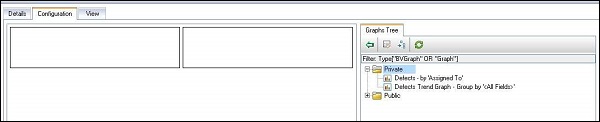
Step 9 : The added graph can now be accessed from "Dashboard" >> "Analysis View".
Dashboard View
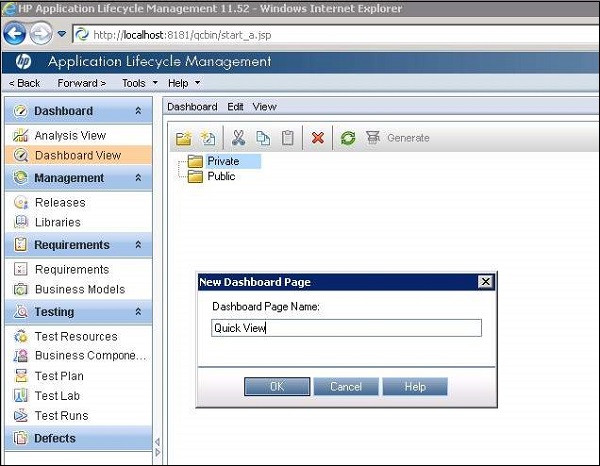
Step 1 − Go to "Dashboard View" and create a "New Folder" if you wish to [or] create a "New Dashboard" page straight away.
Step 2 − Upon creating a "New Dashboard" Page, various tabs are generated. "Configuration" tab is one of them in which users can add those graphs which can be added to the dashboard.
Step 3 − Users should use the "View" tab to view the added dashboard and hit refresh to get the latest data.