
Article Categories
- All Categories
-
 Data Structure
-
 Networking
-
 RDBMS
RDBMS
-
 Operating System
-
 Java
Java
-
 MS Excel
-
 iOS
iOS
-
 HTML
HTML
-
 CSS
CSS
-
 Android
-
 Python
-
 C Programming
-
 C++
C++
-
 C#
C#
-
 MongoDB
-
 MySQL
MySQL
-
 Javascript
-
 PHP
PHP
Selected Reading
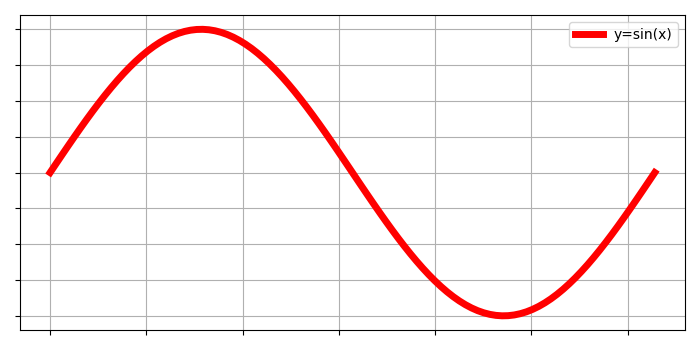
Remove the X-axis ticks while keeping the grids (Matplotlib)
To remove the X-ticks while keeping the grids, we can take the following steps−
- Use gca() method to get the current axes, creating one if necessary.
- Plot the x and np.sin(x) using plot() method with linewidth=5, label y=sin(x).
- Remove yticks and xticks by passing empty array in the argument of set_xticklabels and set_yticklabels methods respectively.
- Configure grid lines by putting flag as True.
- Place the legend for the plot label in the argument.
- To display the figure, use show() method.
Example
import matplotlib.pyplot as plt
import numpy as np
plt.rcParams["figure.figsize"] = [7.00, 3.50]
plt.rcParams["figure.autolayout"] = True
x = np.linspace(0, 2*np.pi, 100)
ax = plt.gca()
ax.plot(x, np.sin(x), c='r', lw=5, label='y=sin(x)')
ax.set_xticklabels([])
ax.set_yticklabels([])
ax.grid(True)
plt.legend(loc="upper right")
plt.show()
Output

Updated on: 2021-05-07T07:46:18+05:30
3K+ Views

Advertisements