- Plotly - Home
- Plotly - Introduction
- Plotly - Environment Setup
- Plotly - Online & Offline Plotting
- Plotting Inline with Jupyter Notebook
- Plotly - Package Structure
- Plotly - Exporting to Static Images
- Plotly - Legends
- Plotly - Format Axis & Ticks
- Plotly - Subplots & Inset Plots
- Plotly - Bar Chart & Pie Chart
- Plotly - Scatter Plot, Scattergl Plot & Bubble Charts
- Plotly - Dot Plots & Table
- Plotly - Histogram
- Plotly - Box Plot Violin Plot & Contour Plot
- Plotly - Distplots, Density Plot & Error Bar Plot
- Plotly - Heatmap
- Plotly - Polar Chart & Radar Chart
- Plotly - OHLC Chart Waterfall Chart & Funnel Chart
- Plotly - 3D Scatter & Surface Plot
- Plotly - Adding Buttons/Dropdown
- Plotly - Slider Control
- Plotly - FigureWidget Class
- Plotly with Pandas and Cufflinks
- Plotly with Matplotlib and Chart Studio
- Plotly Useful Resources
- Plotly - Quick Guide
- Plotly - Cheatsheet
- Plotly - Useful Resources
- Plotly - Discussion
Plotly - Package Structure
Plotly Python package has three main modules which are given below −
- plotly.plotly
- plotly.graph_objs
- plotly.tools
The plotly.plotly module contains functions that require a response from Plotly's servers. Functions in this module are interface between your local machine and Plotly.
The plotly.graph_objs module is the most important module that contains all of the class definitions for the objects that make up the plots you see. Following graph objects are defined −
- Figure,
- Data,
- ayout,
- Different graph traces like Scatter, Box, Histogram etc.
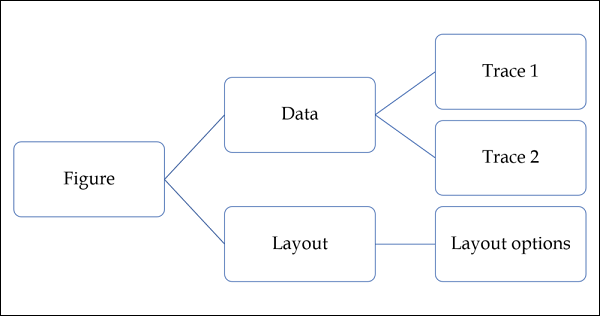
All graph objects are dictionary- and list-like objects used to generate and/or modify every feature of a Plotly plot.
The plotly.tools module contains many helpful functions facilitating and enhancing the Plotly experience. Functions for subplot generation, embedding Plotly plots in IPython notebooks, saving and retrieving your credentials are defined in this module.
A plot is represented by Figure object which represents Figure class defined in plotly.graph_objs module. Its constructor needs following parameters −
import plotly.graph_objs as go
fig = go.Figure(data, layout, frames)
The data parameter is a list object in Python. It is a list of all the traces that you wish to plot. A trace is just the name we give to a collection of data which is to be plotted. A trace object is named according to how you want the data displayed on the plotting surface.
Plotly provides number of trace objects such as scatter, bar, pie, heatmap etc. and each is returned by respective functions in graph_objs functions. For example: go.scatter() returns a scatter trace.
import numpy as np
import math #needed for definition of pi

xpoints=np.arange(0, math.pi*2, 0.05)
ypoints=np.sin(xpoints)

trace0 = go.Scatter(
   x = xpoints, y = ypoints
)
data = [trace0]
The layout parameter defines the appearance of the plot, and plot features which are unrelated to the data. So we will be able to change things like the title, axis titles, annotations, legends, spacing, font and even draw shapes on top of your plot.
layout = go.Layout(title = "Sine wave", xaxis = {'title':'angle'}, yaxis = {'title':'sine'})
A plot can have plot title as well as axis title. It also may have annotations to indicate other descriptions.
Finally, there is a Figure object created by go.Figure() function. It is a dictionary-like object that contains both the data object and the layout object. The figure object is eventually plotted.
py.iplot(fig)
