- Plotly - Home
- Plotly - Introduction
- Plotly - Environment Setup
- Plotly - Online & Offline Plotting
- Plotting Inline with Jupyter Notebook
- Plotly - Package Structure
- Plotly - Exporting to Static Images
- Plotly - Legends
- Plotly - Format Axis & Ticks
- Plotly - Subplots & Inset Plots
- Plotly - Bar Chart & Pie Chart
- Plotly - Scatter Plot, Scattergl Plot & Bubble Charts
- Plotly - Dot Plots & Table
- Plotly - Histogram
- Plotly - Box Plot Violin Plot & Contour Plot
- Plotly - Distplots, Density Plot & Error Bar Plot
- Plotly - Heatmap
- Plotly - Polar Chart & Radar Chart
- Plotly - OHLC Chart Waterfall Chart & Funnel Chart
- Plotly - 3D Scatter & Surface Plot
- Plotly - Adding Buttons/Dropdown
- Plotly - Slider Control
- Plotly - FigureWidget Class
- Plotly with Pandas and Cufflinks
- Plotly with Matplotlib and Chart Studio
- Plotly Useful Resources
- Plotly - Quick Guide
- Plotly - Cheatsheet
- Plotly - Useful Resources
- Plotly - Discussion
Plotly - Online and Offline Plotting
The following chapter deals with the settings for the online and offline plotting. Let us first study the settings for online plotting.
Settings for online plotting
Data and graph of online plot are save in your plot.ly account. Online plots are generated by two methods both of which create a unique url for the plot and save it in your Plotly account.
py.plot() − returns the unique url and optionally open the url.
py.iplot() − when working in a Jupyter Notebook to display the plot in the notebook.
We shall now display simple plot of angle in radians vs. its sine value. First, obtain ndarray object of angles between 0 and 2 using arange() function from numpy library. This ndarray object serves as values on x axis of the graph. Corresponding sine values of angles in x which has to be displayed on y axis are obtained by following statements −
import numpy as np
import math #needed for definition of pi
xpoints = np.arange(0, math.pi*2, 0.05)
ypoints = np.sin(xpoints)
Next, create a scatter trace using Scatter() function in graph_objs module.
trace0 = go.Scatter(
   x = xpoints,
   y = ypoints
)
data = [trace0]
Use above list object as argument to plot() function.
py.plot(data, filename = 'Sine wave', auto_open=True)
Save following script as plotly1.py
import plotly
plotly.tools.set_credentials_file(username='lathkar', api_key='********************')
import plotly.plotly as py
import plotly.graph_objs as go
import numpy as np
import math #needed for definition of pi

xpoints = np.arange(0, math.pi*2, 0.05)
ypoints = np.sin(xpoints)
trace0 = go.Scatter(
   x = xpoints, y = ypoints
)
data = [trace0]
py.plot(data, filename = 'Sine wave', auto_open=True)
Execute the above mentioned script from command line. Resultant plot will be displayed in the browser at specified URL as stated below.
$ python plotly1.py
High five! You successfully sent some data to your account on plotly.
View your plot in your browser at https://plot.ly/~lathkar/0
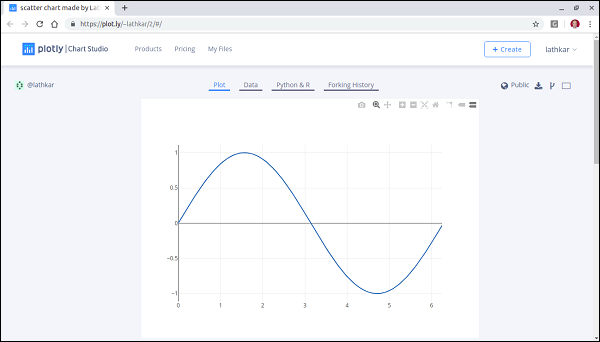
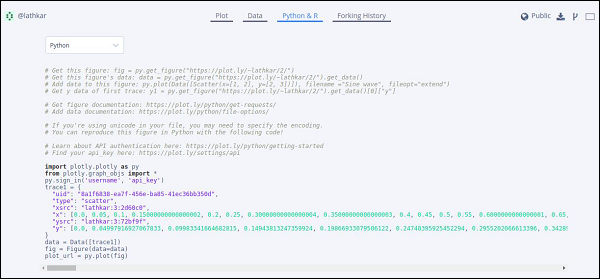
Just above the displayed graph, you will find tabs Plot, Data, Python & Rand Forking history.
Currently, Plot tab is selected. The Data tab shows a grid containing x and y data points. From Python & R tab, you can view code corresponding to current plot in Python, R, JSON, Matlab etc. Following snapshot shows Python code for the plot as generated above −
Setting for Offline Plotting
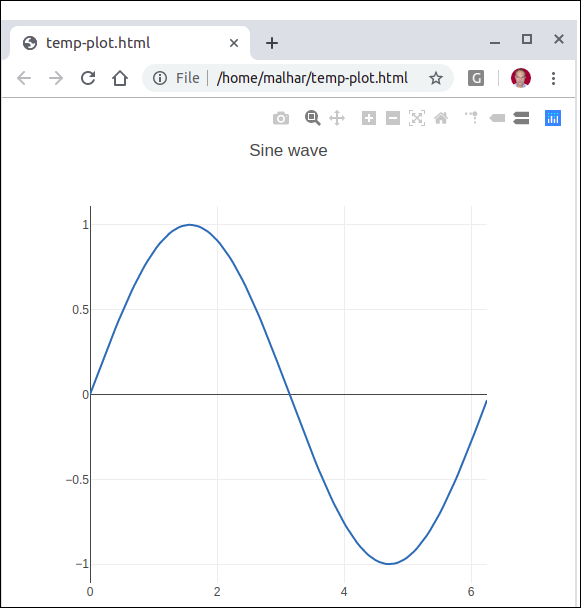
Plotly allows you to generate graphs offline and save them in local machine. The plotly.offline.plot() function creates a standalone HTML that is saved locally and opened inside your web browser.
Use plotly.offline.iplot() when working offline in a Jupyter Notebook to display the plot in the notebook.
Note − Plotly's version 1.9.4+ is needed for offline plotting.
Change plot() function statement in the script and run. A HTML file named temp-plot.html will be created locally and opened in web browser.
plotly.offline.plot(
   { "data": data,"layout": go.Layout(title = "hello world")}, auto_open = True)