
Article Categories
- All Categories
-
 Data Structure
-
 Networking
-
 RDBMS
RDBMS
-
 Operating System
-
 Java
Java
-
 MS Excel
-
 iOS
iOS
-
 HTML
HTML
-
 CSS
CSS
-
 Android
-
 Python
-
 C Programming
-
 C++
C++
-
 C#
C#
-
 MongoDB
-
 MySQL
MySQL
-
 Javascript
-
 PHP
PHP
Selected Reading
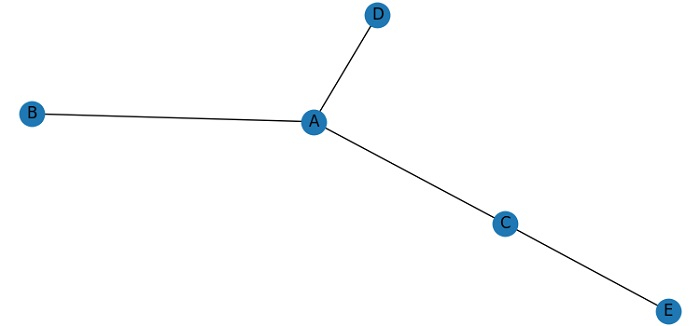
Drawing a network graph with networkX and Matplotlib
To draw a network graph with networkx and matplotlib, plt.show() −
Set the figure size and adjust the padding between and around the subplots.
Make an object for a dataframe with the keys, from and to.
Get a graph containing an edgelist.
Draw a graph (Step 3) using draw() method with some node properties.
To display the figure, use show() method.
Example
import pandas as pd
import networkx as nx
from matplotlib import pyplot as plt
plt.rcParams["figure.figsize"] = [7.50, 3.50]
plt.rcParams["figure.autolayout"] = True
df = pd.DataFrame({'from': ['A', 'B', 'C', 'A'], 'to': ['D', 'A', 'E', 'C']})
G = nx.from_pandas_edgelist(df, 'from', 'to')
nx.draw(G, with_labels=True, node_size=100, alpha=1, linewidths=10)
plt.show()
Output

Updated on: 2021-06-01T12:07:37+05:30
3K+ Views

Advertisements