
Article Categories
- All Categories
-
 Data Structure
-
 Networking
-
 RDBMS
RDBMS
-
 Operating System
-
 Java
Java
-
 MS Excel
-
 iOS
iOS
-
 HTML
HTML
-
 CSS
CSS
-
 Android
-
 Python
-
 C Programming
-
 C++
C++
-
 C#
C#
-
 MongoDB
-
 MySQL
MySQL
-
 Javascript
-
 PHP
PHP
-
 Economics & Finance
Market Demand Curve is the Average Revenue Curve
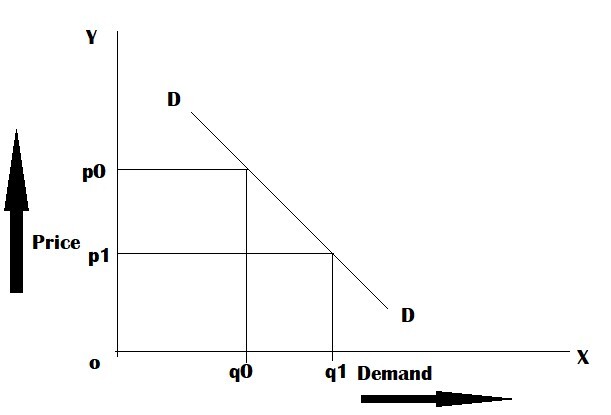
The market demand curve represents the relationship between price and quantity demanded for a good in the entire market. For a monopolist, this market demand curve becomes their average revenue curve, as the price they can charge depends directly on the quantity they choose to sell.
Formula
The relationship between market demand and average revenue for a monopolist can be expressed as:
$$\mathrm{Average\ Revenue\ (AR) = \frac{Total\ Revenue\ (TR)}{Quantity\ (Q)} = Price\ (P)}$$Since the monopolist faces the entire market demand curve:
$$\mathrm{P = f(Q)}$$Where:
- P Price per unit (Average Revenue)
- Q Quantity demanded/sold
- TR Total Revenue
- AR Average Revenue
Example Calculation
Consider a monopolist facing the market demand: P = 100 - 2Q. Let's calculate average revenue at different quantities:
At Q = 10 units:
$$\mathrm{P = 100 - 2(10) = 80}$$ $$\mathrm{TR = P \times Q = 80 \times 10 = 800}$$ $$\mathrm{AR = \frac{TR}{Q} = \frac{800}{10} = 80}$$At Q = 20 units:
$$\mathrm{P = 100 - 2(20) = 60}$$ $$\mathrm{TR = 60 \times 20 = 1200}$$ $$\mathrm{AR = \frac{1200}{20} = 60}$$Notice that AR equals P at each quantity level, confirming that the demand curve is the average revenue curve.
Understanding Market Demand as Average Revenue
The demand curve shows the relationship between price and quantity demanded. For a monopolist, this curve represents their average revenue because:
- Price Maker Unlike competitive firms, monopolists can set prices by choosing output levels
- Single Price When selling all units at the same price, that price becomes the average revenue
- Market Power The monopolist faces the entire market demand, not just a portion
- Downward Slope To sell more units, the monopolist must lower the price on all units
Factors Affecting the Demand Curve Position
- Consumer Income Changes shift the entire curve left or right
- Substitute Prices Higher substitute prices shift demand right
- Consumer Preferences Changing tastes affect curve position
- Population Size More consumers shift demand right
- Future Expectations Expected price changes affect current demand
Real-World Applications
- Pharmaceutical Companies Patent holders use demand curves to set drug prices
- Utility Companies Electric utilities face market demand when setting rates
- Technology Firms Companies with unique products use this relationship for pricing
- Government Regulation Regulators analyze monopolist behavior using demand curves
Comparison
| Market Structure | Demand Curve Faced | Average Revenue | Price Setting Ability |
|---|---|---|---|
| Perfect Competition | Horizontal (Perfectly Elastic) | Constant (= Market Price) | None (Price Taker) |
| Monopoly | Downward Sloping (Market Demand) | Decreasing with Quantity | Full (Price Maker) |
| Oligopoly | Kinked or Downward Sloping | Varies with Strategy | Limited |
Advantages and Limitations
Advantages:
- Simplifies pricing decisions for monopolists
- Helps predict market behavior
- Useful for regulatory analysis
Limitations:
- Assumes single pricing (no price discrimination)
- May not account for strategic customer behavior
- Static model doesn't capture dynamic market changes
Conclusion
The market demand curve serves as the average revenue curve for monopolists because they face the entire market demand. This relationship is fundamental for understanding monopoly pricing behavior and market outcomes.
FAQs
Q1. How many categories of demand curves are there?
There are three categories: individual demand curves, market demand curves, and firm demand curves.
Q2. Which parameters are placed on the X and Y axis of demand curves?
Price is placed on the Y-axis and quantity demanded is placed on the X-axis of a demand curve.
Q3. What happens when other factors affect the demand curve?
When factors other than price affect demand, the entire demand curve shifts to a new position rather than moving along the existing curve.
Q4. Why can't competitive firms use the market demand curve as their average revenue?
Competitive firms are price takers and face a horizontal demand curve at the market price, while monopolists face the downward-sloping market demand curve.
Q5. What is the difference between average revenue and marginal revenue for a monopolist?
Average revenue equals price and follows the demand curve, while marginal revenue is always below the demand curve for a downward-sloping demand.

488 Views
