- KNIME - Home
- KNIME - Introduction
- KNIME - Installation
- KNIME - First Run
- KNIME - Workbench
- KNIME - Running Your First Workflow
- KNIME - Exploring Workflow
- KNIME - Building Your Own Model
- KNIME - Testing the Model
- KNIME - Summary and Future Work
- KNIME Useful Resources
- KNIME - Quick Guide
- KNIME - Useful Resources
- KNIME - Discussion
KNIME - Workbench
When KNIME starts, you will see the following screen −
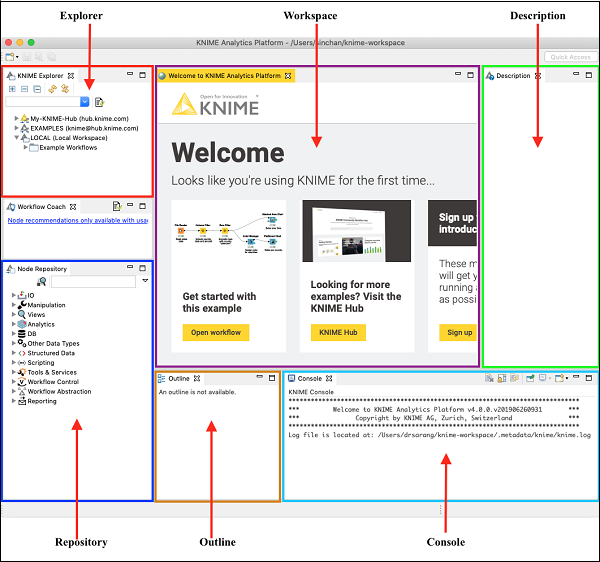
As has been marked in the screenshot, the workbench consists of several views. The views which are of immediate use to us are marked in the screenshot and listed below −
Workspace
Outline
Nodes Repository
KNIME Explorer
Console
Description
As we move ahead in this chapter, let us learn these views each in detail.
Workspace View
The most important view for us is the Workspace view. This is where you would create your machine learning model. The workspace view is highlighted in the screenshot below −
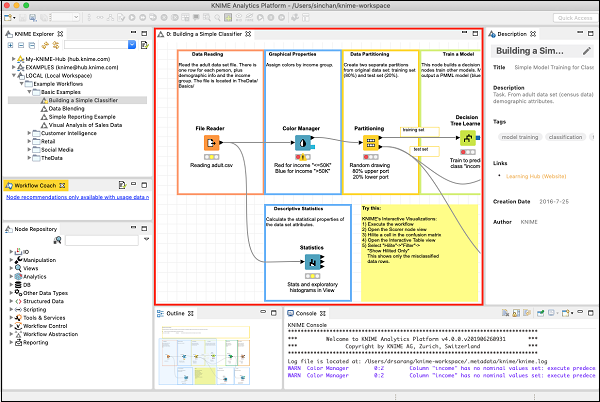
The screenshot shows an opened workspace. You will soon learn how to open an existing workspace.
Each workspace contains one or more nodes. You will learn the significance of these nodes later in the tutorial. The nodes are connected using arrows. Generally, the program flow is defined from left to right, though this is not required. You may freely move each node anywhere in the workspace. The connecting lines between the two would move appropriately to maintain the connection between the nodes. You may add/remove connections between nodes at any time. For each node a small description may be optionally added.
Outline View
The workspace view may not be able to show you the entire workflow at a time. That is the reason, the outline view is provided.
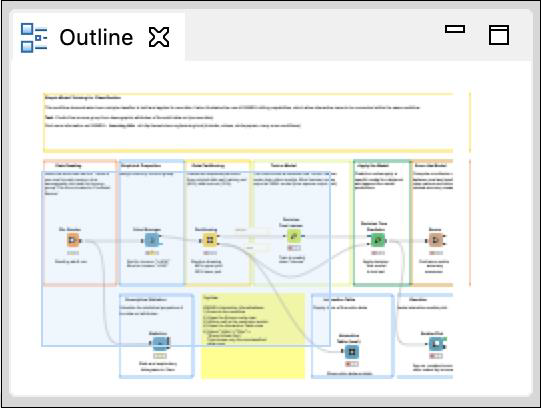
The outline view shows a miniature view of the entire workspace. There is a zoom window inside this view that you can slide to see the different portions of the workflow in the Workspace view.
Node Repository
This is the next important view in the workbench. The Node repository lists the various nodes available for your analytics. The entire repository is nicely categorized based on the node functions. You will find categories such as −
IO
Views
Analytics
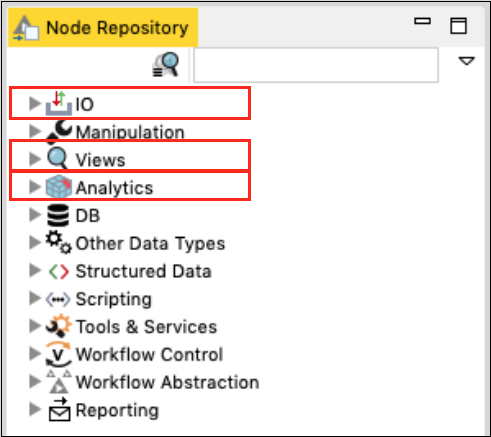
Under each category you would find several options. Just expand each category view to see what you have there. Under the IO category, you will find nodes to read your data in various file formats, such as ARFF, CSV, PMML, XLS, etc.
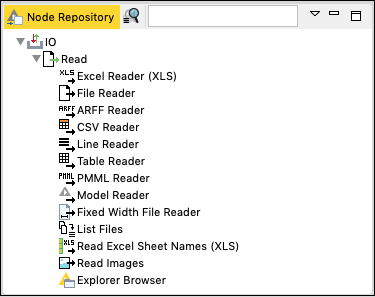
Depending on your input source data format, you will select the appropriate node for reading your dataset.
By this time, probably you have understood the purpose of a node. A node defines a certain kind of functionality that you can visually include in your workflow.
The Analytics node defines the various machine learning algorithms, such as Bayes, Clustering, Decision Tree, Ensemble Learning, and so on.
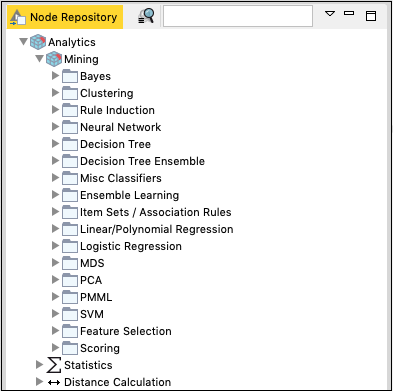
The implementation of these various ML algorithms is provided in these nodes. To apply any algorithm in your analytics, simply pick up the desired node from the repository and add it to your workspace. Connect the output of the Data reader node to the input of this ML node and your workflow is created.
We suggest you to explore the various nodes available in the repository.
KNIME Explorer
The next important view in the workbench is the Explorer view as shown in the screenshot below −
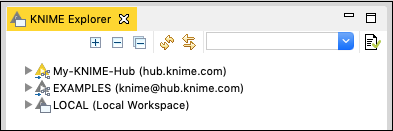
The first two categories list the workspaces defined on the KNIME server. The third option LOCAL is used for storing all the workspaces that you create on your local machine. Try expanding these tabs to see the various predefined workspaces. Especially, expand EXAMPLES tab.
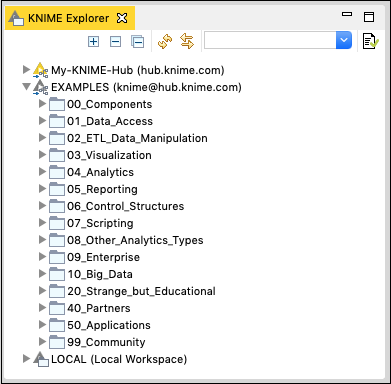
KNIME provides several examples to get you started with the platform. In the next chapter, you will be using one of these examples to get yourself acquainted with the platform.
Console View
As the name indicates, the Console view provides a view of the various console messages while executing your workflow.
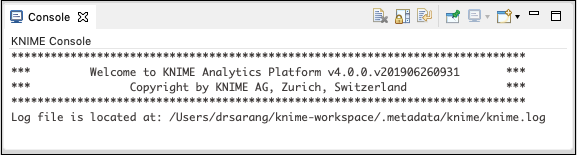
The Console view is useful in diagnosing the workflow and examining the analytics results.
Description View
The last important view that is of immediate relevance to us is the Description view. This view provides a description of a selected item in the workspace. A typical view is shown in the screenshot below −
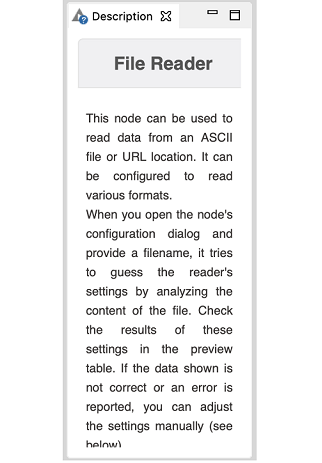
The above view shows the description of a File Reader node. When you select the File Reader node in your workspace, you will see its description in this view. Clicking on any other node shows the description of the selected node. Thus, this view becomes very useful in the initial stages of learning when you do not precisely know the purpose of the various nodes in the workspace and/or the nodes repository.
Toolbar
Besides the above described views, the workbench has other views such as toolbar. The toolbar contains various icons that facilitate a quick action. The icons are enabled/disabled depending on the context. You can see the action that each icon performs by hovering mouse on it. The following screen shows the action taken by Configure icon.

Enabling/Disabling Views
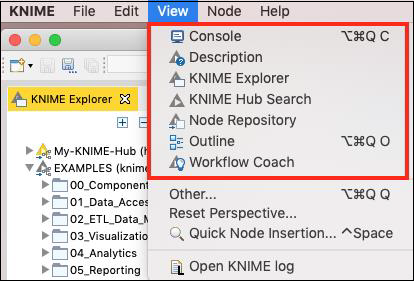
The various views that you have seen so far can be turned on/off easily. Clicking the Close icon in the view will close the view. To reinstate the view, go to the View menu option and select the desired view. The selected view will be added to the workbench.
Now, as you have been acquainted with the workbench, I will show you how to run a workflow and study the analytics performed by it.
