- KNIME - Home
- KNIME - Introduction
- KNIME - Installation
- KNIME - First Run
- KNIME - Workbench
- KNIME - Running Your First Workflow
- KNIME - Exploring Workflow
- KNIME - Building Your Own Model
- KNIME - Testing the Model
- KNIME - Summary and Future Work
- KNIME Useful Resources
- KNIME - Quick Guide
- KNIME - Useful Resources
- KNIME - Discussion
KNIME - Testing the Model
To test the model, execute the following menu options: Node → Execute All
If everything goes correct, the status signal at the bottom of each node would turn green. If not, you will need to look up the Console view for the errors, fix them up and re-run the workflow.
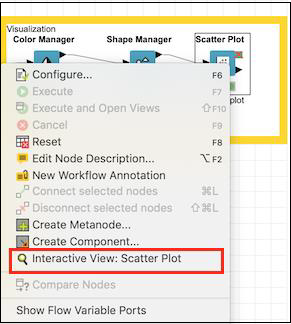
Now, you are ready to visualize the predicted output of the model. For this, right click the Scatter Plot node and select the following menu options: Interactive View: Scatter Plot
This is shown in the screenshot below −
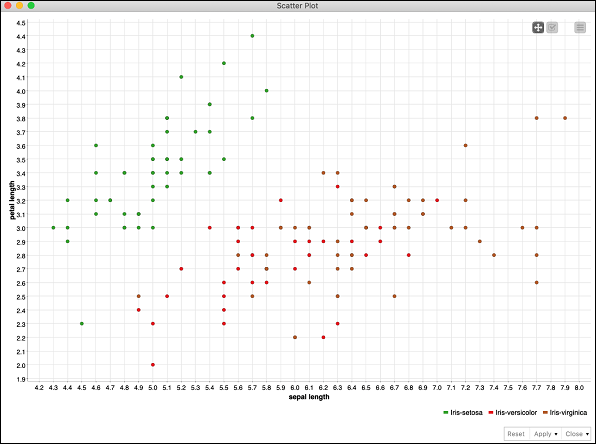
You would see the scatter plot on the screen as shown here −
You can run through different visualizations by changing x- and y- axis. To do so, click on the settings menu at the top right corner of the scatter plot. A popup menu would appear as shown in the screenshot below −
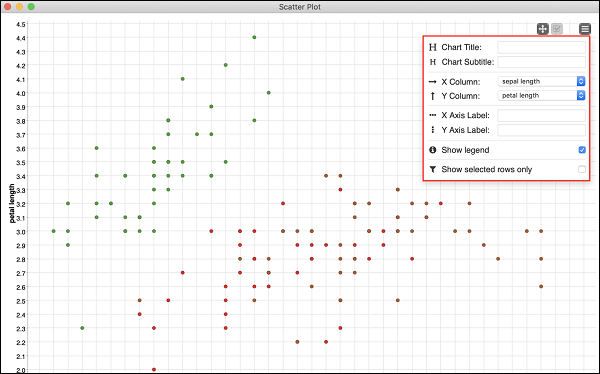
You can set the various parameters for the plot on this screen to visualize the data from several aspects.
This completes our task of model building.
