- Javascript Basics Tutorial
- Javascript - Home
- JavaScript - Roadmap
- JavaScript - Overview
- JavaScript - Features
- JavaScript - Enabling
- JavaScript - Placement
- JavaScript - Syntax
- JavaScript - Hello World
- JavaScript - Console.log()
- JavaScript - Comments
- JavaScript - Variables
- JavaScript - let Statement
- JavaScript - Constants
- JavaScript - Data Types
- JavaScript - Type Conversions
- JavaScript - Strict Mode
- JavaScript - Reserved Keywords
- JavaScript Operators
- JavaScript - Operators
- JavaScript - Arithmetic Operators
- JavaScript - Comparison Operators
- JavaScript - Logical Operators
- JavaScript - Bitwise Operators
- JavaScript - Assignment Operators
- JavaScript - Conditional Operators
- JavaScript - typeof Operator
- JavaScript - Nullish Coalescing Operator
- JavaScript - Safe Assignment Operator
- JavaScript - Delete Operator
- JavaScript - Comma Operator
- JavaScript - Grouping Operator
- JavaScript - Yield Operator
- JavaScript - Spread Operator
- JavaScript - Exponentiation Operator
- JavaScript - Operator Precedence
- JavaScript Control Flow
- JavaScript - If...Else
- JavaScript - While Loop
- JavaScript - For Loop
- JavaScript - For...in
- Javascript - For...of
- JavaScript - Loop Control
- JavaScript - Break Statement
- JavaScript - Continue Statement
- JavaScript - Switch Case
- JavaScript - User Defined Iterators
- JavaScript Functions
- JavaScript - Functions
- JavaScript - Function Expressions
- JavaScript - Function Parameters
- JavaScript - Default Parameters
- JavaScript - Function() Constructor
- JavaScript - Function Hoisting
- JavaScript - Self-Invoking Functions
- JavaScript - Arrow Functions
- JavaScript - Function Invocation
- JavaScript - Function call()
- JavaScript - Function apply()
- JavaScript - Function bind()
- JavaScript - Closures
- JavaScript - Variable Scope
- JavaScript - Global Variables
- JavaScript - Smart Function Parameters
- JavaScript Objects
- JavaScript - Number
- JavaScript - Boolean
- JavaScript - Strings
- JavaScript - Arrays
- JavaScript - Date
- JavaScript - DataView
- JavaScript - Handler
- JavaScript - Math
- JavaScript - RegExp
- JavaScript - Symbol
- JavaScript - Sets
- JavaScript - WeakSet
- JavaScript - Maps
- JavaScript - WeakMap
- JavaScript - Iterables
- JavaScript - Reflect
- JavaScript - TypedArray
- JavaScript - Template Literals
- JavaScript - Tagged Templates
- Object Oriented JavaScript
- JavaScript - Objects
- JavaScript - Classes
- JavaScript - Object Properties
- JavaScript - Object Methods
- JavaScript - Static Methods
- JavaScript - Display Objects
- JavaScript - Object Accessors
- JavaScript - Object Constructors
- JavaScript - Native Prototypes
- JavaScript - ES5 Object Methods
- JavaScript - Encapsulation
- JavaScript - Inheritance
- JavaScript - Abstraction
- JavaScript - Polymorphism
- JavaScript - Destructuring
- JavaScript - Destructuring Assignment
- JavaScript - Object Destructuring
- JavaScript - Array Destructuring
- JavaScript - Nested Destructuring
- JavaScript - Optional Chaining
- JavaScript - Global Object
- JavaScript - Mixins
- JavaScript - Proxies
- JavaScript Versions
- JavaScript - History
- JavaScript - Versions
- JavaScript - ES5
- JavaScript - ES6
- ECMAScript 2016
- ECMAScript 2017
- ECMAScript 2018
- ECMAScript 2019
- ECMAScript 2020
- ECMAScript 2021
- ECMAScript 2022
- JavaScript Asynchronous
- JavaScript - Asynchronous
- JavaScript - Callback Functions
- JavaScript - Promises
- JavaScript - Async/Await
- JavaScript - Microtasks
- JavaScript - Promisification
- JavaScript - Promises Chaining
- JavaScript - Timing Events
- JavaScript - setTimeout()
- JavaScript - setInterval()
- JavaScript Cookies
- JavaScript - Cookies
- JavaScript - Cookie Attributes
- JavaScript - Deleting Cookies
- JavaScript Browser BOM
- JavaScript - Browser Object Model
- JavaScript - Window Object
- JavaScript - Document Object
- JavaScript - Screen Object
- JavaScript - History Object
- JavaScript - Navigator Object
- JavaScript - Location Object
- JavaScript - Console Object
- JavaScript Web APIs
- JavaScript - Web API
- JavaScript - History API
- JavaScript - Storage API
- JavaScript - Forms API
- JavaScript - Worker API
- JavaScript - Fetch API
- JavaScript - Geolocation API
- JavaScript Events
- JavaScript - Events
- JavaScript - DOM Events
- JavaScript - addEventListener()
- JavaScript - Mouse Events
- JavaScript - Keyboard Events
- JavaScript - Form Events
- JavaScript - Window/Document Events
- JavaScript - Event Delegation
- JavaScript - Event Bubbling
- JavaScript - Event Capturing
- JavaScript - Custom Events
- JavaScript Error Handling
- JavaScript - Error Handling
- JavaScript - try...catch
- JavaScript - Debugging
- JavaScript - Custom Errors
- JavaScript - Extending Errors
- JavaScript Important Keywords
- JavaScript - this Keyword
- JavaScript - void Keyword
- JavaScript - new Keyword
- JavaScript - var Keyword
- JavaScript HTML DOM
- JavaScript - HTML DOM
- JavaScript - DOM Methods & Properties
- JavaScript - DOM Document
- JavaScript - DOM Elements
- JavaScript - DOM Attributes (Attr)
- JavaScript - DOM Forms
- JavaScript - Changing HTML
- JavaScript - Changing CSS
- JavaScript - DOM Animation
- JavaScript - DOM Navigation
- JavaScript - DOM Collections
- JavaScript - DOM NodeList
- JavaScript - DOM DOMTokenList
- JavaScript Advanced Chapters
- JavaScript - Bubble Sort Algorithm
- JavaScript - Circular Reference Error
- JavaScript - Code Testing with Jest
- JavaScript - CORS Handling
- JavaScript - Data Analysis
- JavaScript - Dead Zone
- JavaScript - Design Patterns
- JavaScript - Engine and Runtime
- JavaScript - Execution Context
- JavaScript - Function Composition
- JavaScript - Immutability
- JavaScript - Kaboom.js
- JavaScript - Lexical Scope
- JavaScript - Local Storage
- JavaScript - Memoization
- JavaScript - Minifying JS
- JavaScript - Mutability vs Immutability
- JavaScript - Package Manager
- JavaScript - Parse S-Expressions
- JavaScript - Prototypal Inheritance
- JavaScript - Reactivity
- JavaScript - Require Function
- JavaScript - Selection API
- JavaScript - Session Storage
- JavaScript - SQL CRUD Operations
- JavaScript - Supercharged Sorts
- JavaScript - Temporal Dead Zone
- JavaScript - Throttling
- JavaScript - TRPC Library
- JavaScript - Truthy and Falsy Values
- JavaScript - Upload Files
- JavaScript - Date Comparison
- JavaScript - Recursion
- JavaScript - Data Structures
- JavaScript - Base64 Encoding
- JavaScript - Callback Function
- JavaScript - Current Date/Time
- JavaScript - Date Validation
- JavaScript - Filter Method
- JavaScript - Generating Colors
- JavaScript - HTTP Requests
- JavaScript - Insertion Sort
- JavaScript - Lazy Loading
- JavaScript - Linked List
- JavaScript - Nested Loop
- JavaScript - Null Checking
- JavaScript - Get Current URL
- JavaScript - Graph Algorithms
- JavaScript - Higher Order Functions
- JavaScript - Empty String Check
- JavaScript - Form Handling
- JavaScript - Functional Programming
- JavaScript - Parameters vs Arguments
- JavaScript - Prototype
- JavaScript - Reactive Programming
- JavaScript - Reduce Method
- JavaScript - Rest Operator
- JavaScript - Short Circuiting
- JavaScript - Undefined Check
- JavaScript - Unit Testing
- JavaScript - Validate URL
- JavaScript Miscellaneous
- JavaScript - Ajax
- JavaScript - Async Iteration
- JavaScript - Atomics Objects
- JavaScript - Rest Parameter
- JavaScript - Page Redirect
- JavaScript - Dialog Boxes
- JavaScript - Page Printing
- JavaScript - Validations
- JavaScript - Animation
- JavaScript - Multimedia
- JavaScript - Image Map
- JavaScript - Browsers
- JavaScript - JSON
- JavaScript - Multiline Strings
- JavaScript - Date Formats
- JavaScript - Get Date Methods
- JavaScript - Set Date Methods
- JavaScript - Modules
- JavaScript - Dynamic Imports
- JavaScript - BigInt
- JavaScript - Blob
- JavaScript - Unicode
- JavaScript - Shallow Copy
- JavaScript - Call Stack
- JavaScript - Reference Type
- JavaScript - IndexedDB
- JavaScript - Clickjacking Attack
- JavaScript - Currying
- JavaScript - Graphics
- JavaScript - Canvas
- JavaScript - Debouncing
- JavaScript - Performance
- JavaScript - Style Guide
- JavaScript Useful Resources
- JavaScript - Questions And Answers
- JavaScript - Quick Guide
- JavaScript - Cheatsheet
- JavaScript - Functions
- JavaScript - Resources
- JavaScript - Online Editor
JavaScript - Debugging
What is Debugging?
Debugging in JavaScript is a process of examining JavaScript code and finding erros and fixing them. Every now and then, developers commit mistakes while coding. This error can be logical, syntax, or runtime errors. An error in a program or a script is referred to as a bug.
The process of finding and fixing bugs is called debugging and is a normal part of the development process. This section covers tools and techniques that can help you with debugging tasks.
Let's look at the different methods of debugging.
Use a JavaScript Debugger
A debugger is an application that places all aspects of script execution under the control of the programmer. Debuggers provide fine-grained control over the state of the script through an interface that allows you to examine and set values as well as control the flow of execution.
Once a script has been loaded into a debugger, it can be run one line at a time or instructed to halt at certain breakpoints. Once execution is halted, the programmer can examine the state of the script and its variables in order to determine if something is amiss. You can also watch variables for changes in their values.
Nowadays, all modern browser comes with built-in debuggers. You can use the console of the browser to debug the JavaScript code.
How to Open Console in the Browser?
In this section, you will learn to open the console in different browsers.
Open Console in Chrome
Press the Below keys.
Windows/Linux − Ctrl + Shift + I or Ctrl + Shift + J
macOs − Cmd + Option + I or Cmd + Option + J
OR
Step 1 − Open Chrome web browser and open the web page in a new window.
Step 2 − Right-click anywhere on the web page.
Step 3 − It will pop up menu. Select the last option, which is 'inspect'.
Step 4 − It will open a Chrome developer tool.
Step 5 − Go to the console tab.
Open Console in Firefox
Press the Below keys.
Windows/Linux − Ctrl + Shift + I or Ctrl + Shift + J
macOs − Cmd + Option + I or Cmd + Option + J
OR
Step 1 − Open Firefox web browser and open the web page in a new window.
Step 2 − Right-click anywhere on the web page.
Step 3 − Select the last option from the popup menu, which is 'inspect(Q)'.
Step 4 − It will open a developer tool.
Step 5 − You can move from the 'inspector' tab to the 'console' tab.
Open Console in Microsoft Edge
Press the Below keys.
Windows/Linux − Ctrl + Shift + I or Ctrl + Shift + J
macOs − Cmd + Option + I or Cmd + Option + J
OR
Step 1 − Open the Microsoft Edge browser.
Step 2 − Right-click anywhere on the web page.
Step 3 − Click on 'inspect' in the popup menu.
Step 4 − You will see the developer tool is opened.
Step 5 − Next, you can change the 'Elements' tab to the 'Console' tab in the developer tool.
Open Console in Safari
Press the Below keys.
Windows/Linux − Ctrl + Shift + I or Ctrl + Shift + J
macOs − Cmd + Option + I or Cmd + Option + J
OR
Step 1 − Open the Safari web browser.
Step 2 − Open the Safari main menu from the top menu bar.
Step 3 − Choose 'preferences' in the dropdown menu. Next, choose the 'advanced' option.
Step 4 − Check the checkbox named 'Enable Show Develop menu in menu bar' to enable the developer tool. Next, close the preference window.
Step 5 − Next, reopen the main menu and select 'Develop. After that, select the 'Show Error Console.
Open Console in Opera
Press the Below keys.
Windows/Linux − Ctrl + Shift + I or Ctrl + Shift + J
macOs − Cmd + Option + I or Cmd + Option + J
OR
Step 1 − Open the Opera browser.
Step 2 − Open the main menu from the top corner.
Step 3 − In the main menu, select the 'Developer. It will open the sub-menu.
Step 4 − In the submenu, select the 'developer tools.
Step 5 − Next, select the 'console. It will open a console.
Using the console.log() method
The console.log() method prints the message in the web browser's console. It can print primitive values, objects, variable values, etc.
You can print the variable's value in the console you want to debug.
Syntax
Users can follow the syntax below to use the console.log() method.
Console.log(val1, val2, ...);
The console.log() method takes the comma-separated arguments to print in the web browser's console.
Example
In the code below, we add the value of the num1 and num2 variables. In the browser, you can see that the sum is 32 rather than 5.
So, you are required to debug the code.
When you print the type of the num1 and num2 into the console, it shows that the type of the num1 is a string. So, it converts the value of the num2 variable into the string and appends it with the value of the num1.
<html>
<body>
   <div id = "output"> </div>
   <p>Note: To see the resullt in console, please open it before you run the code.</p>
   <script>
      let num1 = "3";
      let num2 = 2;
      let sum = num1 + num2;
      document.getElementById("output").innerHTML = "The sum is: " + sum;
      console.log("typeof num1 is " + typeof num1);
      console.log("typeof num2 is " + typeof num2);
   </script>
</body>
</html>
Output
The sum is: 32
Note: To see the resullt in console, please open it before you run the code.
It will produce the following result in the web console −
typeof num1 is string
VM75616:7 typeof num2 is number
Example
In the code below, we have a person object containing various properties. We print the firstname and lastname properties of the person object in the web browser. It prints undefined.
To find the error, you are required to debug the code. Next, we print the object in the console and found that the Person object doesn't contain the firstname and lastname properties; instead of that, it contains the 'name' property.
<html>
<body>
   <div id = "demo"> </div>
   <p>Note: To see the resullt in console, please open it before you run the code.</p>
   <script>
      let output = document.getElementById("demo");
      let person = {
         name: "John",
         age: 25,
         city: "New York"
      }
      output.innerHTML = "The name of the person is: " + person.name + "<br>";
      output.innerHTML += "The city of the person is: " + person.city + "<br>";
      console.log(person);
   </script>
</body>
</html>
Output
The name of the person is: John
The city of the person is: New York
Note: To see the resullt in console, please open it before you run the code.
It will produce the following result in the web console −
{name: 'John', age: 25, city: 'New York'}
Using the debugger Keyword
You can go to your browser's console's 'source' panel to debug the code.
The 'debugger' keyword allows you to force-stop the execution of the JavaScript code.
Stopping the execution of the JavaScript code allows you to debug the code line-by-line.
Once you find the bug or everything looks fine, you can resume the execution of the JavaScript code.
You can open the console and run the below code in the browser. It will automatically pause the code, and you can observe the values of the variables to debug the code.
Example
The below example is the same as above. We have added the 'debugger' keyword before it prints the values of the object properties.
It will pause the execution of the code before printing the values of properties. After that, when you click on the resume button, it will resume the execution of the code.
<html>
<body>
   <div id = "demo"> </div>
   <script>
      const output = document.getElementById("demo");
      const person = {
         name: "John",
         age: 25,
         city: "New York"
      }
      debugger;
      output.innerHTML = "The name of the person is: " + person.name + "<br>";
      output.innerHTML += "The city of the person is: " + person.city;
   </script>
</body>
</html>
Output
The name of the person is: John
The city of the person is: New York
You will see the result in console similar to the below screenshot. To see the resullt in console, please open it before you run the code.
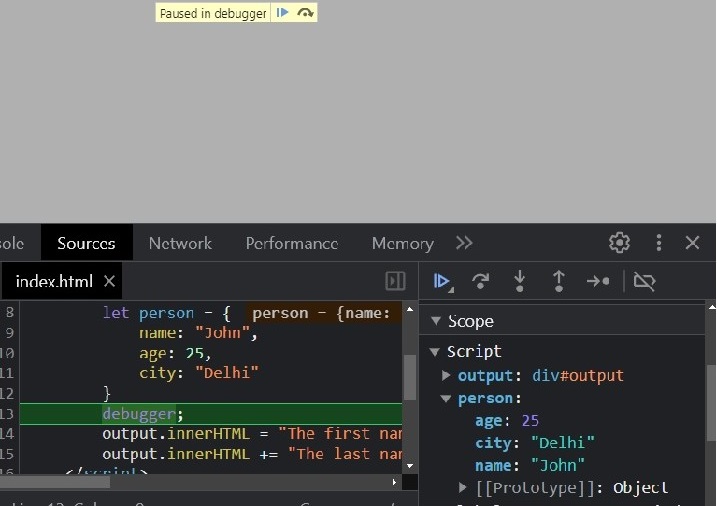
The above image shows the pause button at the top of the browser window and the object or variables in the bottom-right corner. This way, you can check variable values and debug the code to fix the bugs.
Setting Break Points in the Browser's Debugger
Setting up breakpoints is the same as using the 'debugger' keyword to debug the JavaScript code. So, this is an alternative way.
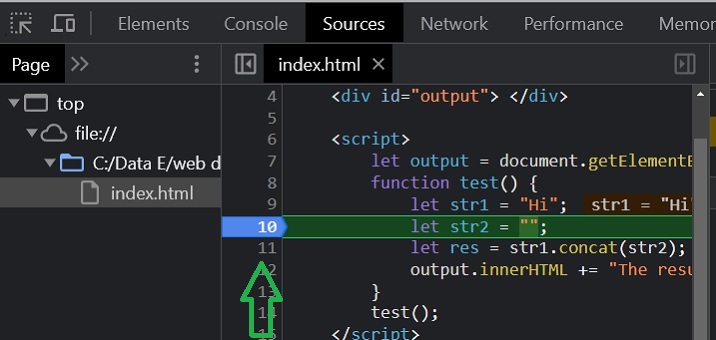
In the 'source' panel, you can click on the line number where you want to add a breakpoint, as shown in the image below.
After that, when you execute the JavaScript code, it will stop the execution of the code, and you can observe the variable values on the right side.
Example
We have defined the test() function in the example code below. The test() function concatenates the str1 and str2 strings.
We have opened the 'source' panel in the browser in the developer tool. After that, we have added the breakpoint on the line 'let res = str1.concat(str2);'. So, the debugger will stop the execution of the code at this line, and you can click the resume button to resume the execution of the code.
<html>
<body>
   <div id = "output">The resultant string after appending str2 to str1 is: </div>
   <script>
      function test() {
         let str1 = "Hi";
         let str2 = "";
         let res = str1.concat(str2);
         document.getElementById("output").innerHTML += res;
      }
      test();
   </script>
</body>
</html>
Output
The resultant string after appending str2 to str1 is: Hi
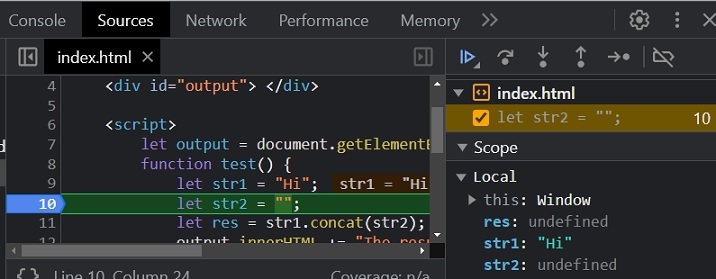
You will see the result in console similar to the below screenshot. To see the resullt in console, please open it before you run the code.
Useful Tips for Developers
You can keep the following tips in mind to reduce the number of errors in your scripts and simplify the debugging process −
Use plenty of comments. Comments enable you to explain why you wrote the script the way you did and to explain particularly difficult sections of code.
Always use indentation to make your code easy to read. Indenting statements also makes it easier for you to match up beginning and ending tags, curly braces, and other HTML and script elements. You can use the code formatters in the IDE.
Write modular code. Whenever possible, group your statements into functions. Functions let you group related statements and test and reuse portions of code with minimal effort.
Be consistent in the way you name your variables and functions. Try using names that are long enough to be meaningful and that describe the variable's contents or the function's purpose.
Use consistent syntax when naming variables and functions. In other words, keep them all lowercase or all uppercase; if you prefer Camel-Back notation, use it consistently.
Test long scripts in a modular fashion. In other words, do not try to write the entire script before testing any portion of it. Write a piece and get it to work before adding the next portion of code.
Use descriptive variable and function names and avoid using single-character names.
Watch your quotation marks. Remember that quotation marks are used in pairs around strings and that both quotation marks must be of the same style (either single or double).
Watch your equal signs. You should not use a single = for comparison purposes.
Declare variables explicitly using the var keyword.
