 Data Structure
 Networking
 RDBMS
RDBMS Operating System
 Java
Java MS Excel
 iOS
iOS HTML
HTML CSS
CSS Android
 Python
 C Programming
 C++
C++ C#
C# MongoDB
 MySQL
MySQL Javascript
 PHP
PHP
- Selected Reading
- UPSC IAS Exams Notes
- Developer's Best Practices
- Questions and Answers
- Effective Resume Writing
- HR Interview Questions
- Computer Glossary
- Who is Who
How to vary the line color with data index for line graph in matplotlib?
To have the line color vary with the data index for a line graph in matplotlib, we can take the following steps −
Steps
Set the figure size and adjust the padding between and around the subplots.
Create x and y data points using numpy.
Get smaller limit, dydx.
Get the points and segments data points using numpy.
Create a figure and a set of subplots.
Create a class which, when called, linearly normalizes data into some range.
Set the image array from numpy array *A*.
Set the linewidth(s) for the collection.
Set the colorbar for axis 1.
Generate Colormap object from a list of colors i.e r, g and b.
Repeat steps 6, 7, 8, 9 and 10.
Set the limit of the X and Y axes.
To display the figure, use show() method.
Example
import numpy as np
import matplotlib.pyplot as plt
from matplotlib.collections import LineCollection
from matplotlib.colors import ListedColormap, BoundaryNorm

plt.rcParams["figure.figsize"] = [7.50, 3.50]
plt.rcParams["figure.autolayout"] = True

x = np.linspace(0, 3 * np.pi, 500)
y = np.sin(x)

dydx = np.cos(0.5 * (x[:-1] + x[1:]))
points = np.array([x, y]).T.reshape(-1, 1, 2)
segments = np.concatenate([points[:-1], points[1:]], axis=1)

fig, axs = plt.subplots(2, 1, sharex=True, sharey=True)
norm = plt.Normalize(dydx.min(), dydx.max())

lc = LineCollection(segments, cmap='viridis', norm=norm)
lc.set_array(dydx)
lc.set_linewidth(2)

line = axs[0].add_collection(lc)
fig.colorbar(line, ax=axs[0])
cmap = ListedColormap(['r', 'g', 'b'])
norm = BoundaryNorm([-1, -0.5, 0.5, 1], cmap.N)

lc = LineCollection(segments, cmap=cmap, norm=norm)
lc.set_array(dydx)
lc.set_linewidth(2)

line = axs[1].add_collection(lc)
fig.colorbar(line, ax=axs[1])

axs[0].set_xlim(x.min(), x.max())
axs[0].set_ylim(-1.1, 1.1)

plt.show()
Output
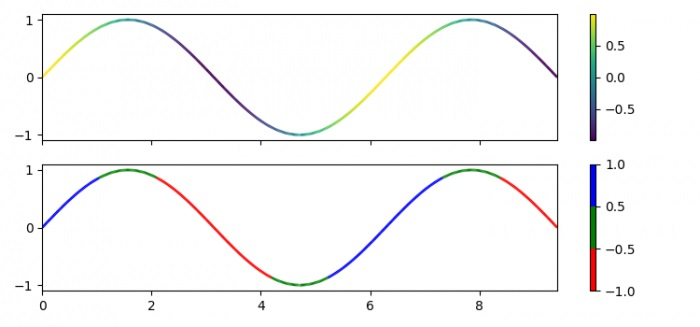
It will produce the following output −


Advertisements
