
Article Categories
- All Categories
-
 Data Structure
-
 Networking
-
 RDBMS
RDBMS
-
 Operating System
-
 Java
Java
-
 MS Excel
-
 iOS
iOS
-
 HTML
HTML
-
 CSS
CSS
-
 Android
-
 Python
-
 C Programming
-
 C++
C++
-
 C#
C#
-
 MongoDB
-
 MySQL
MySQL
-
 Javascript
-
 PHP
PHP
-
 Economics & Finance
Selected Reading
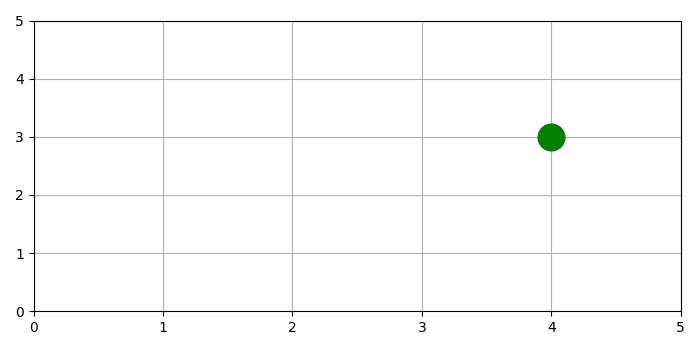
How to remove the outline of a circle marker when using pyplot.plot in Matplotlib?
To remove the outline of a circle marker, we can reduce the value of marker edge width.
Initialize list for x and y, with a single value.
Limit x and y axis range for 0 to 5.
Lay out a grid in current line style.
Plot the given x and y using plot() method, with marker="o", markeredgecolor="red", markerfacecolor="green" and minimum markeredgewidth to remove the outline.
To display the figure, use show() method.
Example
from matplotlib import pyplot as plt
plt.rcParams["figure.figsize"] = [7.00, 3.50]
plt.rcParams["figure.autolayout"] = True
x = [4]
y = [3]
plt.xlim(0, 5)
plt.ylim(0, 5)
plt.grid()
plt.plot(x, y, marker="o", markersize=20, markeredgecolor="black", markerfacecolor="green", markeredgewidth=.1)
plt.show()
Output

Updated on: 2021-05-06T13:52:23+05:30
1K+ Views

Advertisements