
Article Categories
- All Categories
-
 Data Structure
-
 Networking
-
 RDBMS
RDBMS
-
 Operating System
-
 Java
Java
-
 MS Excel
-
 iOS
iOS
-
 HTML
HTML
-
 CSS
CSS
-
 Android
-
 Python
-
 C Programming
-
 C++
C++
-
 C#
C#
-
 MongoDB
-
 MySQL
MySQL
-
 Javascript
-
 PHP
PHP
-
 Economics & Finance
Selected Reading
How to remove outliers from multiple boxplots created with the help of boxplot function for columns of a data frame using single line code in R?
A data frame can have multiple numerical columns and we can create boxplot for each of the columns just by using boxplot function with data frame name but if we want to exclude outliers then outline argument can be used. For example, if we have a data frame df with multiple numerical columns that contain outlying values then the boxplot without outliers can be created as boxplot(df,outline=FALSE).
Example
Consider the below data frame:
set.seed(151)
x1<-c(-5,rnorm(18),5)
x2<-c(-6,rnorm(18,1,0.2),6)
x3<-c(-10,rnorm(18,1,0.5),10)
x4<-c(-12,rnorm(18,1,0.1),12)
x5<-c(-15,rnorm(18,1,0.8),15)
df<-data.frame(x1,x2,x3,x4,x5)
df
Output
        x1          x2          x3       x4          x5
1 -5.00000000 -6.0000000 -10.0000000 -12.0000000 -15.0000000
2 -0.05153895 1.1347052  1.7228397    1.0216649    0.5526645
3 0.76573738  1.0620079  1.1305064    1.0407813    1.2837024
4 -0.14673959 0.7255857  1.9645730    0.9528957    0.9981142
5 -0.11318581 0.6726474  0.7000570    0.9979680    1.4502265
6 -0.39551140 0.9280697  1.0449886    0.9596063    1.1528738
7 0.78227595  1.2402230  1.2416571    1.0422124    0.8461499
8 -1.39747811 0.8708252  2.0122390    0.8796052    0.7642688
9 -1.01883832 0.8978782  1.8157587    0.8944016    0.3106157
10 0.22947586 0.8801754  1.6851877    1.0137921    2.2427285
11 0.67217297 1.1091206 -0.2065685    0.9715086    0.7642430
12 -0.48455178 0.9017412 0.5728289    1.0170325    2.6194087
13 0.56060896 1.0383071  1.2811840    0.9864194    2.3656720
14 0.06615648 0.8882945  0.8173998    0.8232215    1.4163186
15 -1.34987612 1.1845399 0.8286647    0.7985602    1.0698010
16 -0.24291581 1.2307996 0.6122296    1.0941148    1.3163952
17 -1.23674102 0.7255179 0.9935761    0.9278766    1.8420136
18 -1.47467765 1.2580363 1.3498465    0.9826864    1.0976992
19 2.43715892  1.2309804 1.0159605    0.8997847    0.9828209
20 5.00000000  6.0000000 10.0000000   12.0000000   15.0000000
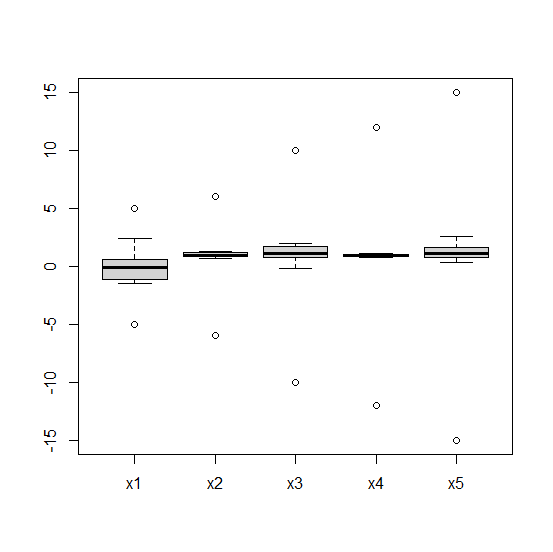
Creating boxplot for columns of df −
Example
boxplot(df)
Output
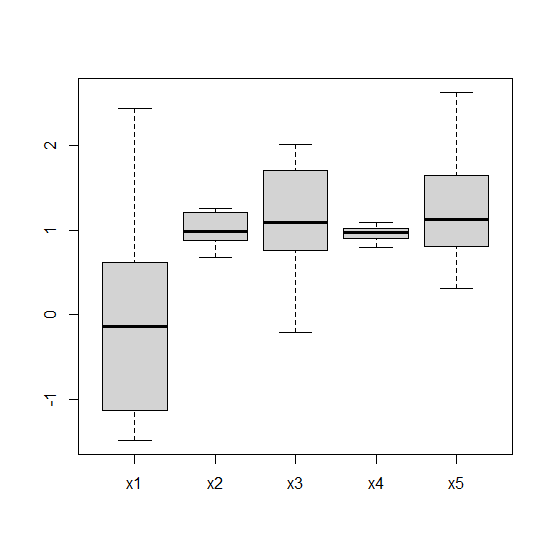
Creating boxplot for columns of df without outliers −
Example
boxplot(df,outline=FALSE)
Output

Updated on: 2026-03-11T22:50:52+05:30
633 Views

Advertisements