
Article Categories
- All Categories
-
 Data Structure
-
 Networking
-
 RDBMS
RDBMS
-
 Operating System
-
 Java
Java
-
 MS Excel
-
 iOS
iOS
-
 HTML
HTML
-
 CSS
CSS
-
 Android
-
 Python
-
 C Programming
-
 C++
C++
-
 C#
C#
-
 MongoDB
-
 MySQL
MySQL
-
 Javascript
-
 PHP
PHP
-
 Economics & Finance
Selected Reading
How to extract the outliers of a boxplot in R?
To extract the outliers of a boxplot, we can use out function along with the boxplot function. For example, if we have a vector called X which contains some outliers then we can extract those outliers by using the command given below −
boxplot(df$X,plot=FALSE)$out
This command will not create a plot as plot is set to FALSE.
Example
Following snippet creates a sample data frame −
df=data.frame(x=rlnorm(25))
df
The following dataframe is created −
     x
1  0.5699270
2  3.5812629
3  0.3507882
4  0.1400328
5  0.7239948
6  2.5494114
7  3.1243611
8  5.3207739
9  0.1672539
10 7.6235529
11 0.4950263
12 1.1713592
13 1.6590328
14 0.4404338
15 0.1354914
16 0.6192213
17 1.0878246
18 0.4084088
19 0.3980110
20 1.3915935
21 0.8679156
22 1.5447279
23 0.9476949
24 0.4036890
25 3.6822067
To create boxplot of x, add the following code to the above snippet −
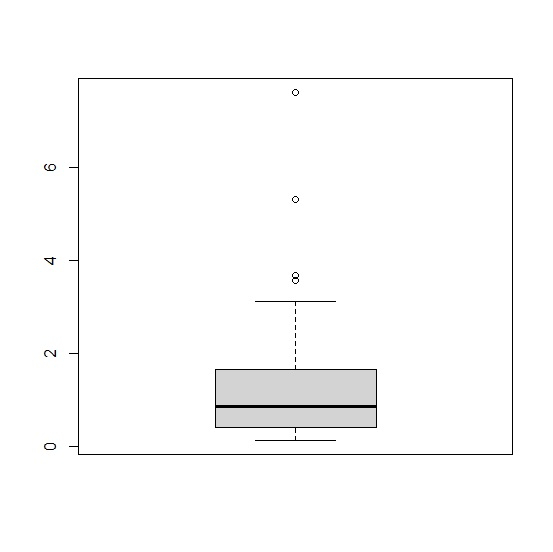
df=data.frame(x=rlnorm(25))
boxplot(df$x)
Output
If you execute all the above given snippets as a single program, it generates the following output: −
To extract outliers from above boxplot, add the following code to the above snippet −
df=data.frame(x=rlnorm(25))
boxplot(df$x,plot=FALSE)$out
Output
If you execute all the above given snippets as a single program, it generates the following output: −
[1] 3.581263 5.320774 7.623553 3.682207

Updated on: 2021-11-11T05:12:10+05:30
3K+ Views

Advertisements