
Article Categories
- All Categories
-
 Data Structure
-
 Networking
-
 RDBMS
RDBMS
-
 Operating System
-
 Java
Java
-
 MS Excel
-
 iOS
iOS
-
 HTML
HTML
-
 CSS
CSS
-
 Android
-
 Python
-
 C Programming
-
 C++
C++
-
 C#
C#
-
 MongoDB
-
 MySQL
MySQL
-
 Javascript
-
 PHP
PHP
-
 Economics & Finance
Selected Reading
How to plot a wav file using Matplotlib?
To plot a .wav file using matplotlib, we can take following the steps −
To read a .wav file, we can use the read() method.
After reading the .wav file, we will get a tuple. At the 0 th index, rate would be there and at the 1st index, array sample data.
Use the plot() method to plot the .wav file.
Set y and x labels using ylabel and xlabel with “Amplitude” and “Time” label, respectively.
To display the figure, use the show() method.
Example
from scipy.io.wavfile import read
import matplotlib.pyplot as plt
plt.rcParams["figure.figsize"] = [7.50, 3.50]
plt.rcParams["figure.autolayout"] = True
input_data = read("my_audio.wav")
audio = input_data[1]
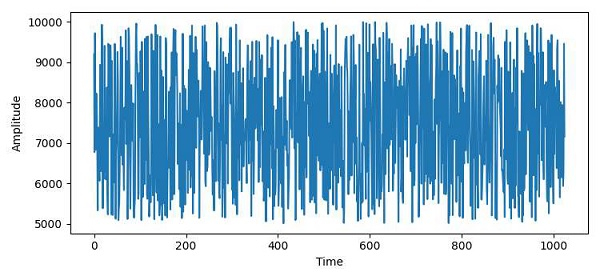
plt.plot(audio[0:1024])
plt.ylabel("Amplitude")
plt.xlabel("Time")
plt.show()
Output

Updated on: 2021-04-09T12:31:42+05:30
7K+ Views

Advertisements