 Data Structure
 Networking
 RDBMS
RDBMS Operating System
 Java
Java MS Excel
 iOS
iOS HTML
HTML CSS
CSS Android
 Python
 C Programming
 C++
C++ C#
C# MongoDB
 MySQL
MySQL Javascript
 PHP
PHP
- Selected Reading
- UPSC IAS Exams Notes
- Developer's Best Practices
- Questions and Answers
- Effective Resume Writing
- HR Interview Questions
- Computer Glossary
- Who is Who
How to manually add a legend with a color box on a Matplotlib figure?
Matplotlib is a popular data visualization library in Python known for its flexibility and high-quality visualizations. By following this tutorial, you will learn how to create a legend with a color box on your Matplotlib figure, making your visualizations more informative and visually appealing.
Before diving into the code, it is important to understand the different elements of a legend. A legend is a key that labels the elements in our plot with different colors, markers, or lines. By adding a legend, we can understand the data being presented and make it easier for the audience to interpret our visualizations. In the next section, we will look at the syntax for creating a legend with a color box on a Matplotlib figure.
Syntax
To manually add a legend with a color box on a Matplotlib figure in Python, we can use the following syntax ?
# Import libraries
import matplotlib.patches as mpatches

# Creating legend with color box
color_patch = mpatches.Patch(color='red', label='legend')
plt.legend(handles=[color_patch])
In the above syntax, the color box is created by using the mpatches.Patch function with the color parameter set to 'red'. The resulting blue color box is added to the legend by using the plt.legend function with the handles parameter set to [color_patch]. Although the color box itself is not visible in the plot, it appears in the legend as a colored rectangle next to the label text. The size and shape of the color box can be adjusted using additional parameters in the mpatches.Patch functions, such as linewidth, edgecolor, and facecolor. The below example explains it well.
Example
In this example, the first step is to import the necessary libraries, which are matplotlib.patches and matplotlib.pyplot. Then, we create a simple line plot using the plt.plot() function and pass in a list of x-coordinates and y-coordinates as arguments, along with the color of the line.
Next, we set the title of the plot using the plt.title() function. The main focus of this code is on the creation of the legend with a color box. We do this by creating a patch using the mpatches.Patch() function, which takes in several arguments such as the color of the patch, the label to display in the legend, and additional parameters like linewidth and alpha. Then, we create a color_box patch with a red color and a label of "Example Legend". We also set the linewidth to 12 and the alpha to 0.5 to adjust the size and transparency of the patch.
Finally, we add the patch to the legend using the plt.legend() function, passing in the handles parameter with a list of patches to be included in the legend. We also set the location of the legend to the "upper right" corner and adjusted the frame transparency with the framealpha parameter and frameon to True.
Overall, by adjusting the parameters in the mpatches.Patch() function, you can customize the size, shape, and color of the color box to match your visualization needs. The plot is finally displayed using the plt.show() .
import matplotlib.patches as mpatches
import matplotlib.pyplot as plt

# Creating plot
plt.plot([1, 2, 3, 4], color='blue')
plt.title('Example 1')

# Creating legend with color box
color_box = mpatches.Patch(color='red', label='Example Legend', linewidth=12, alpha=0.5)
plt.legend(handles=[color_box], loc='upper right', framealpha=0.5, frameon=True)

# Show plot
plt.show()
Output

Example
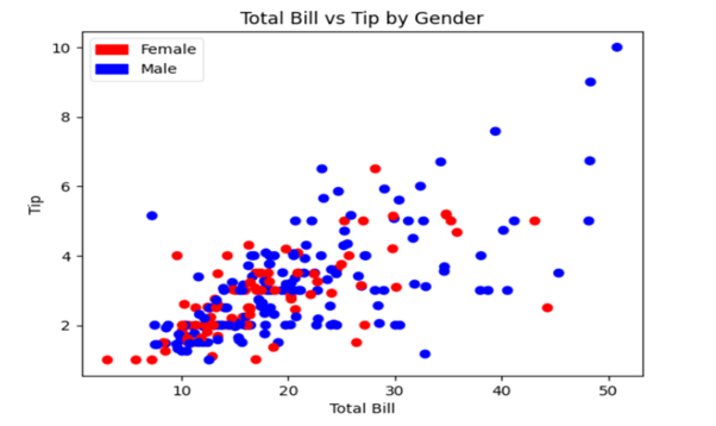
The example imports the required libraries, including Plotly Express, for importing the tips dataset using the px.data.tips() function and Matplotlib's pyplot and patches for constructing the plot and legend.
The scatter plot is created using the ax.scatter() function from matplotlib. The x-axis represents the total bill amount, and the y-axis represents the tip size. The 'c' parameter is used to specify the color of the markers based on the 'sex' column of the tips dataset. The .map() function is used to map the string values "Female" and "Male" to the corresponding color values "red" and "blue".
To create the legend in the example, mpatches.Patch() function is used to manually create color boxes with specific colors and labels for "Female" and "Male". These patches are then added to the plot using plt.legend() function along with the handles for the patches and location on the plot. The transparency and presence of a frame around the legend are also adjusted using framealpha and frameon parameters.
Finally, the plot is given a title and axis labels using plt.title(), plt.xlabel(), and plt.ylabel(). The plot is then displayed using plt.show().
import matplotlib.pyplot as plt
import matplotlib.patches as mpatches
import plotly.express as px

# Load tips dataset from plotly.express
tips = px.data.tips()
# Create scatter plot
fig, ax = plt.subplots()
ax.scatter(tips['total_bill'], tips['tip'], c=tips['sex'].map({'Female': 'red', 'Male': 'blue'}))

# Create a legend with a color box
female_patch = mpatches.Patch(color='red', label='Female')
male_patch = mpatches.Patch(color='blue', label='Male')
plt.legend(handles=[female_patch, male_patch], loc='upper left', framealpha=0.5, frameon=True)

# Set plot title and axis labels
plt.title('Total Bill vs Tip by Gender')
plt.xlabel('Total Bill')
plt.ylabel('Tip')

# Show plot
plt.show()
Output

Conclusion
In conclusion, adding a legend with a color box to a Matplotlib figure can be a useful way to visually represent the data and improve the overall readability of the figure. We may modify the color box to meet our needs by using the mpatches.Patch function. This includes changing the box's size, shape, and color. The color box legend can be added to the figure and customized for the location and look using the plt.legend function. Working with simple or complex data can benefit from learning

