
 Data Structure
 Networking
 RDBMS
RDBMS Operating System
 Java
Java MS Excel
 iOS
iOS HTML
HTML CSS
CSS Android
 Python
 C Programming
 C++
C++ C#
C# MongoDB
 MySQL
MySQL Javascript
 PHP
PHP
- Selected Reading
- UPSC IAS Exams Notes
- Developer's Best Practices
- Questions and Answers
- Effective Resume Writing
- HR Interview Questions
- Computer Glossary
- Who is Who
How to Make a Bell Curve in Python?
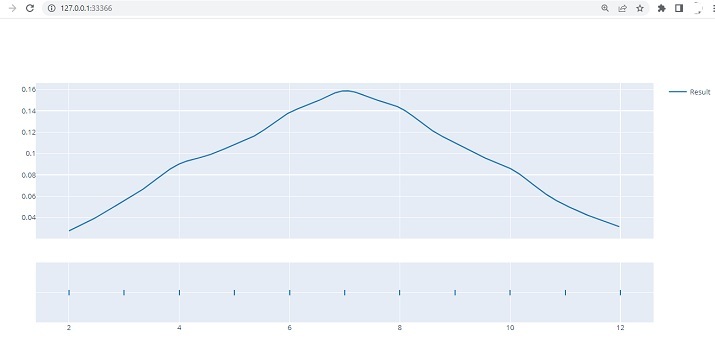
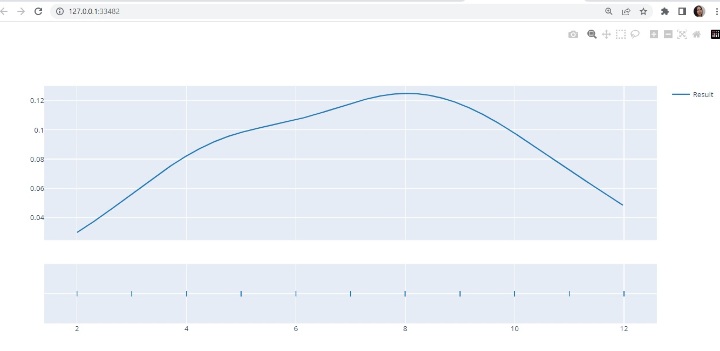
It is a well-known phenomenon that if we take the average of many observations of a random variable, the distribution converges to a normal distribution as the number of observations is increased. For example, if we throw two dice and calculate the sum of the random values that show on these dice each time, it will show a bell-shaped curve as the values that are measured will show the normal tendency. It is also observed that it will not show a perfect bell-shaped curve if it is done only 50 times, and it will show a good bell-shaped curve if it is repeated 1000 times or more.
The normal distribution is symmetrical around its finite mean. Sometimes, the task is to show this bell-shaped curve for data visualization. In this article, using three different examples, the Python library called Plotly is used with Python code to make the bell curve. In the first example, the Python code is written for making a dataset using the sum of random outcomes from two dice and then it is used to make the curve. In the other two examples, the height and weight dataset from Kaggle is used, to show that height and weight also show these normal bell-shaped curves.
Example 1: Add the Outcomes on two Dices and use this data to make the Bell-shaped Curve Using Python and Plotly
Python Code Design Steps for Example 1
Step 1 ? First import pandas and plotly. Plotly is the open-source graphing library for Python that is used for making different type of plots.
Step 2 ? Now use random.randint(1, 6), to get random values for dice one and dice two. Add these values.
Step 3 ? Insert all these sums in dice_oneplustwo[].
Step 4 ? Print the values stored in dice_oneplustwo[].
Step 5 ? From plotly.figure_factory, use the function called create_distplot() and make the graph.
Step 6 ? Run the program using cmd window. The plot will open in a new tab in the browser and will show a bell shaped curve.
Make a File Called dice.py. Write the Following Code in this File
import plotly.figure_factory as ffdemo
import random
dice_oneplustwo = []
#throw 2 dices at same time and add their outcomes
#Repeat this 2000 times
for i in range(0, 2000):
   diceone = random.randint(1, 6)
   dicetwo = random.randint(1, 6)
   dice_oneplustwo.append(diceone + dicetwo)
print(dice_oneplustwo)
dice_bellcurve = ffdemo.create_distplot([dice_oneplustwo],["Result"],show_hist = False)
dice_bellcurve.show()
Run the Python File in the Command Window
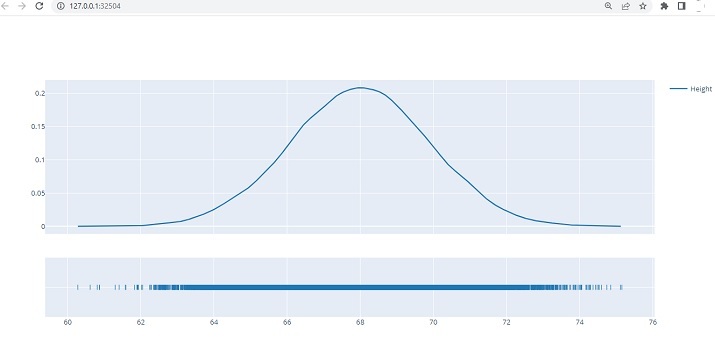
Viewing The Bell Shaped Curve as Result - Example 1
Example 2: Using Kaggle data set for Heights to Show a bell Shaped Curve
Python Code Design Steps
Step 1 ? First import pandas and plotly. Plotly is the open-source graphing library for Python that is used for making different types of plots.
Step 2 ? Log in to Kaggle and download the dataset
(SOCR-HeightWeight.csv) for heights and weights.
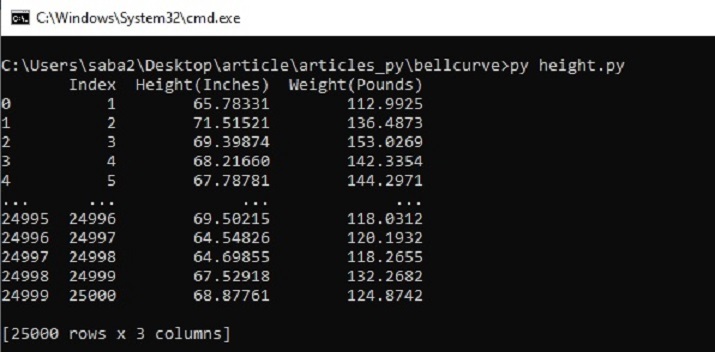
Step 3 ? Read this csv file and make a dataframe. Print this dataframe.
Step 4 ? From plotly.figure_factory, use the function called create_distplot().
Step 5 ? Use the heights data column to make the graph. (Example 2) OR Use the weights data column to make the graph. (Example 3)
Step 6 ? Run the programs using cmd window. The plot will open in a new tab in the browser and will show a bell-shaped curve.
Saving the data file / csv file Required for data Analysis
To make the bell shaped curve, we will use the dataset (SOCR-HeightWeight.csv) for heights, available on Kaggle. Login to Kaggle and then download the csv file from this link ?
https://www.kaggle.com/datasets/burnoutminer/heights-and-weightsdataset/download?datasetVersionNumber=1
Make a File Called Weight.py. Write the Following code in This File.
# import this library to make the bell curve
import plotly.figure_factory as ffdemo

# Pandas library
import pandas as pdd

# read the csv and make a dataframe
datafrm = pdd.read_csv("C:\Users\saba2\Desktop\article\articles_py\bellcurve\SOCR-HeightWeight.csv")
#print the dataframe
print(datafrm)

#make the bell curve
bell_fig = ffdemo.create_distplot([datafrm["Height(Inches)"].tolist()], ["Height"], show_hist=False)

#show the bell curve
bell_fig.show()
Run the python file in the Command window ?
Viewing The Bell Shaped Curve as Result - Example 2
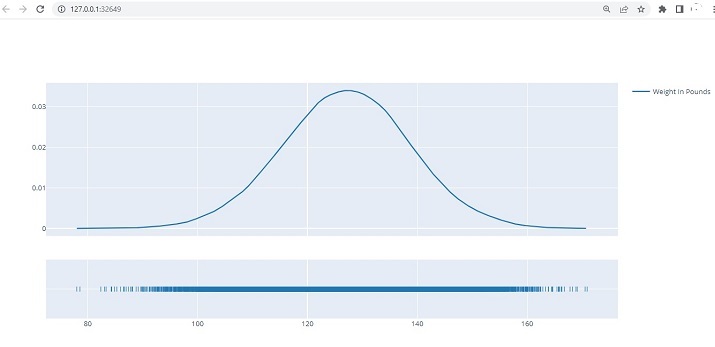
Example 3: Using Kaggle data set for weights to show a bell shaped curve.
Python Code Design Steps
Step 1 ? Import the required libraries. Plotly is the open-source graphing library for Python that is used for making different types of plots.
Step 2 ? Log in to Kaggle and download the dataset
(SOCR-HeightWeight.csv) for heights and weights
Step 3 ? Read this csv file and make a dataframe. Print this dataframe.
Step 4 ? From plotly.figure_factory, use the function called create_distplot().
Step 5 ? Utilize the weights data column to make the graph.
Step 6 ? Deploy the programs using cmd window. The plot would open in a new tab in the browser and will show a bell-shaped curve.
Saving the data file / csv file required for data analysis ?
To make the bell shaped curve, we will use the dataset (SOCR-HeightWeight.csv) for heights, available on Kaggle. Login to Kaggle and then download the CSV file from this link ?
https://www.kaggle.com/datasets/burnoutminer/heights-and-weightsdataset/download?datasetVersionNumber=1
Make a file Called Weight.py. Write the Following code in This file.
# import this library to make the bell curve
import plotly.figure_factory as ffdemo

# Pandas library
import pandas as pdd

# read the csv and make a dataframe
datafrm =
pdd.read_csv("C:\Users\saba2\Desktop\article\articles_py\bellcurve\SO
CR-HeightWeight.csv")

#print the dataframe
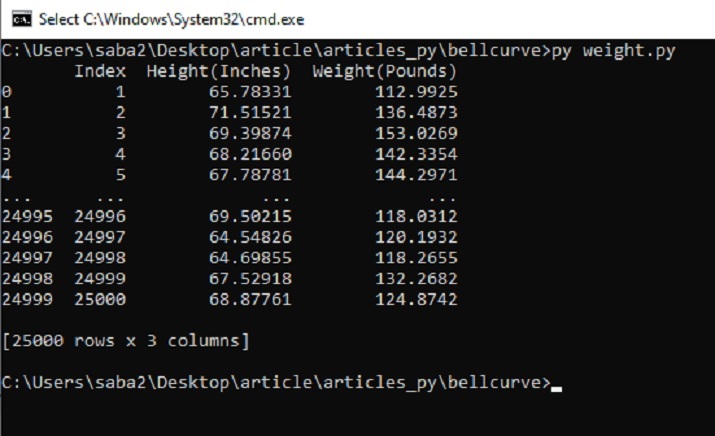
print(datafrm)

#make the bell curve
bell_fig = ffdemo.create_distplot([datafrm["Weight(Pounds)"].tolist()],
["Weight In Pounds"], show_hist=False)

#show the bell curve
bell_fig.show()
Run the python file in the Command window ?
Viewing The Bell Shaped Curve as Result - Example 3
In this Python and Plotly article, three different examples, the ways to show how to make a bell curve using the Python library called Plotly are given. First, the method is given where a normal tendency dataset is made by repeating the throw of two dice 2000 times and adding their outcomes. This dataset is then used to make a bell-shaped curve. In example 2 and example 3, the Python programs are written based on the data set taken from Kaggle for heights and weights, and this data is used to make the bellcurves.

