 Data Structure
 Networking
 RDBMS
RDBMS Operating System
 Java
Java MS Excel
 iOS
iOS HTML
HTML CSS
CSS Android
 Python
 C Programming
 C++
C++ C#
C# MongoDB
 MySQL
MySQL Javascript
 PHP
PHP
- Selected Reading
- UPSC IAS Exams Notes
- Developer's Best Practices
- Questions and Answers
- Effective Resume Writing
- HR Interview Questions
- Computer Glossary
- Who is Who
How to Embed Cartopy in a Python Tkinter GUI?
Python's versatility as a programming language is evident not only in its vast array of libraries but also in its capability to seamlessly integrate different tools for diverse applications. One such powerful combination is the integration of Cartopy, a library for geospatial data visualization, with Tkinter, a standard GUI toolkit in Python. This integration allows developers to create interactive applications that leverage both the mapping capabilities of Cartopy and the GUI features of Tkinter.
In this article, we will explore the steps to embed Cartopy in a Python Tkinter GUI, enabling the creation of geospatial visualizations within a user-friendly interface.
What is Cartopy?
Before diving into the integration process, it's essential to understand the basics of Cartopy.
Cartopy is a library built on top of Matplotlib that specializes in creating maps and projections. It simplifies the process of working with geospatial data, providing support for a wide range of map projections, coastlines, and geographical features. Cartopy is particularly valuable for tasks involving the visualization of data on a map, making it a popular choice in scientific research, meteorology, and geospatial analysis.
Embedding Cartopy in Tkinter
Now, let's delve into the steps to embed Cartopy in a Python Tkinter GUI.
Step 1: Setting Up the Environment
Before we begin embedding Cartopy in a Tkinter GUI, ensure that you have both libraries installed in your Python environment. You can install them using the following commands
pip install cartopy
# Tkinter is usually included with Python, but you can install it using:
pip install tk
Step 2: Importing the Required Modules
Once cartopy installed, the next step is to import the necessary modules, including Tkinter for GUI components, Matplotlib for creating plots, and Cartopy for geospatial functionalities. Additionally, we import the FigureCanvasTkAgg class, which facilitates embedding Matplotlib figures into Tkinter applications.
import tkinter as tk
from matplotlib.backends.backend_tkagg import FigureCanvasTkAgg
import matplotlib.pyplot as plt
import cartopy.crs as ccrs
Step 3: Creating the Tkinter Application Class
Next, we create a class for our Tkinter application. In this class, we initialize the Tkinter window, set up a Matplotlib figure with a Cartopy map projection, and add features to the map.
class CartopyTkinterApp:
   def __init__(self, root):
      self.root = root
      self.root.title("Cartopy in Tkinter")

      # Create a Matplotlib figure and axes with a Cartopy map projection
      self.fig, self.ax = plt.subplots(subplot_kw={'projection': ccrs.PlateCarree()})

      # Add some Cartopy features for demonstration purposes
      self.ax.coastlines()
      self.ax.stock_img()
      self.ax.set_title("Cartopy Map in Tkinter")

      # Create a Tkinter canvas for the Matplotlib figure
      self.canvas = FigureCanvasTkAgg(self.fig, master=root)
      self.canvas_widget = self.canvas.get_tk_widget()

      # Pack the canvas into the Tkinter window
      self.canvas_widget.pack(side=tk.TOP, fill=tk.BOTH, expand=1)

      # Add a Quit button to close the application
      quit_button = tk.Button(root, text="Quit", command=root.quit)
      quit_button.pack(side=tk.BOTTOM)
Step 4: Running the Tkinter Main Loop
Finally, we create an instance of our Tkinter application class, and start the Tkinter main loop.
if __name__ == "__main__":
   # Create the main window
root = tk.Tk()
root.title("Embedding Cartopy in Tkinter")

# Set window dimensions
root.geometry("720x250")

   # Create an instance of the CartopyTkinterApp class
   app = CartopyTkinterApp(root)

   # Start the Tkinter main loop
   root.mainloop()
Example
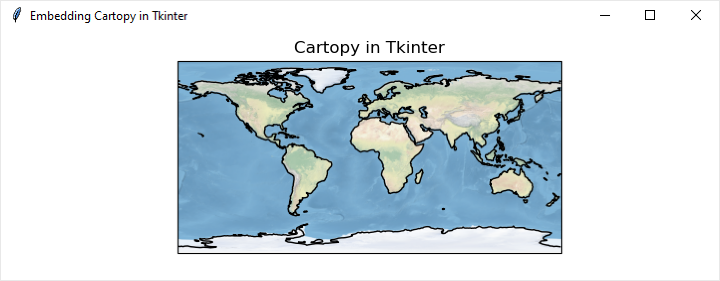
The complete implementation example is as follows
# import the necessary libraries
import tkinter as tk
from matplotlib.backends.backend_tkagg import FigureCanvasTkAgg
import matplotlib.pyplot as plt
import cartopy.crs as ccrs
class CartopyTkinterApp:
   def __init__(self, root):
      self.root = root
      self.root.title("Embedding Cartopy in Tkinter")

      # Create a Matplotlib figure and axes with a Cartopy map projection
      self.fig, self.ax = plt.subplots(subplot_kw={'projection': ccrs.PlateCarree()})

      # Add some Cartopy features for demonstration purposes
      self.ax.coastlines()
      self.ax.stock_img()
      self.ax.set_title("Cartopy in Tkinter")

      # Create a Tkinter canvas for the Matplotlib figure
      self.canvas = FigureCanvasTkAgg(self.fig, master=root)
      self.canvas_widget = self.canvas.get_tk_widget()

      # Pack the canvas into the Tkinter window
      self.canvas_widget.pack(side=tk.TOP, fill=tk.BOTH, expand=1)

      # Add a Quit button to close the application
      quit_button = tk.Button(root, text="Quit", command=root.quit)
      quit_button.pack(side=tk.BOTTOM)
if __name__ == "__main__":
   # Create the main window
   root = tk.Tk()
   # Set window dimensions
   root.geometry("720x250")

   # Create an instance of the CartopyTkinterApp class
   app = CartopyTkinterApp(root)

   # Start the Tkinter main loop
   root.mainloop()
Output

Customizing the Application
Now that we have a basic setup, you can customize the application according to your specific needs. You can add functionality to load and visualize geospatial data, customize map projections, or include interactive elements. Cartopy provides extensive capabilities for working with geospatial data, and integrating them with Tkinter opens up possibilities for building sophisticated applications.
Conclusion
In conclusion, embedding Cartopy in a Python Tkinter GUI allows developers to harness the power of geospatial visualizations within a user-friendly interface. This integration not only enhances the presentation of geographical data but also provides a platform for creating interactive applications with diverse functionalities. By following the steps outlined in this article, developers can seamlessly combine the capabilities of Cartopy and Tkinter, opening new avenues for applications in fields such as climate science, geography, and data analysis. As technology continues to advance, the synergy between different Python libraries fosters a rich ecosystem for developers to explore and leverage in their projects.

