 Data Structure
 Networking
 RDBMS
RDBMS Operating System
 Java
Java MS Excel
 iOS
iOS HTML
HTML CSS
CSS Android
 Python
 C Programming
 C++
C++ C#
C# MongoDB
 MySQL
MySQL Javascript
 PHP
PHP
- Selected Reading
- UPSC IAS Exams Notes
- Developer's Best Practices
- Questions and Answers
- Effective Resume Writing
- HR Interview Questions
- Computer Glossary
- Who is Who
How to create animated meteogram Python?
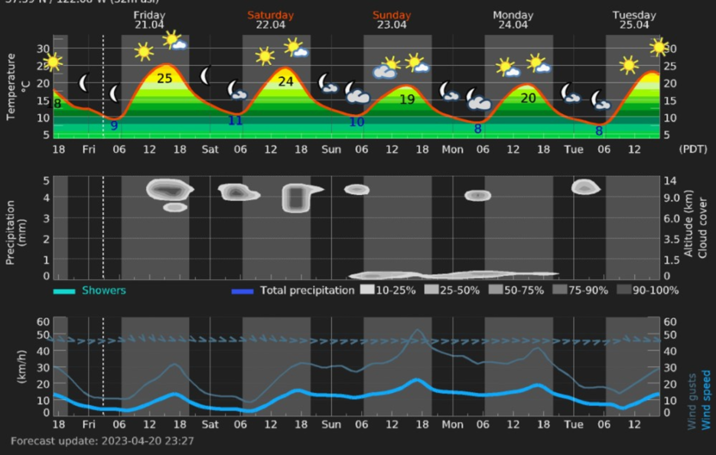
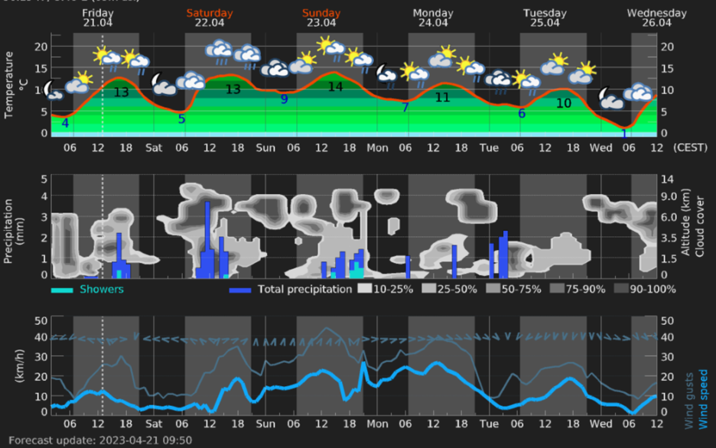
Meteograms are graphical representations of weather data over a specific time period, typically displayed on a single plot. They provide a concise and visual way to represent multiple weather variables, such as temperature, humidity, wind speed, precipitation, etc., over time. Meteograms are widely used in meteorology and weather forecasting to analyze and visualize weather trends and changes.
A typical Meteogram consists of a time axis along the x-axis, representing the time period of interest, and one or more vertical axes along the y-axis, representing the weather variables being plotted. Each weather variable is typically plotted as a line or a bar, with variations in the variable's value over time indicated by the shape, colour, or other visual cues. Meteograms may also include additional information, such as icons, symbols, or annotations to provide additional context or highlight important weather events.
Meteograms are useful for gaining insights into weather patterns, identifying trends, and forecasting weather conditions. They are widely used in various industries and applications, including aviation, agriculture, energy, transportation, and outdoor activities, as they provide a clear and concise representation of weather data for decision-making purposes. Meteograms can be created using various programming tools and libraries, such as Python with libraries like Matplotlib, seaborn, or specialized weather APIs like meteoblue to fetch and plot weather data in a graphical format.
You need to register on the meteoblue website and sign up for the geolocation newsletter before we begin building Meteogram. It will take a few days for you to receive a few Meteograms of your preferred area. Then, after a few days, we receive nearly 7-8 day Meteograms of the geolocation, and after we receive them via email, we download the attachments of the Meteograms and place them in some folder.
Syntax
To create an animated Meteogram, you need to follow the following syntax ?
imagepath.glob(extensionpattern)
# syntax for image.io
imageio.imread(filename)
imageio.mimwrite(filename or fileobject, imagelist)

# syntax for PIL and Matplotlib
image = PIL.Image.open(imageframe)
ani = animation.FuncAnimation(figure, updateFrameFunction, framesCount, interval)
ani.save(mp4 filename, writer)
The first line finds files in a directory based on a specific extension pattern. imageio.imread reads an image file from the specified filename. Imageio.mimwrite writes a list of image data as an animated GIF.
The PIL part opens an image file, creates an animation with specified parameters, and saves it as an MP4 video file, respectively.
Example 1
The given code creates an animated Meteogram using Python's pathlib and imageio libraries. It first imports the necessary libraries, including Path from pathlib for file path manipulation and imageio for reading and writing image data. It then defines the directory where the Meteogram images are located using Path and uses glob to find all PNG files in that directory. It reads each image file using imageio.imread() and appends the image data to a list. Finally, it uses imageio.mimwrite() to write the list of image data as an animated GIF file, creating an animated meteogram.
from pathlib import Path
import imageio
image_directory = Path('../input/meteograms')
image_files = list(image_directory.glob('*.png'))
image_data = []
for file in image_files:
   image_data.append(imageio.imread(file))

imageio.mimwrite('animatedmeteogram.gif', image_data)
Output

Example 2
In this example, the code creates an animated Meteogram using Python's Matplotlib library and PIL (Pillow) for image processing. It first imports the necessary libraries and defines a figure and axis for the plot. It then reads a series of images from a specified directory using the Path library, sorts them based on their filenames, and defines a function to update the frames of the animation. The animation is created using the FuncAnimation class from Matplotlib, specifying the figure, the update function, and the number of frames. Finally, the animation is saved as an MP4 video file using the 'imagemagick' writer.
from PIL import Image
import numpy as np
import matplotlib.pyplot as plt
import matplotlib.animation as animation
from pathlib import Path
fig, ax = plt.subplots()
image_path = Path('../input/meteograms')
images = list(image_path.glob('*.png'))
images = sorted(images, key=lambda x: int(x.stem))
def updateFrames(frame):
   im = Image.open(images[frame])
   im = np.array(im)
   ax.imshow(im)
   ax.set_axis_off()
ani = animation.FuncAnimation(fig, updateFrames, frames=len(images), interval=500)
ani.save('animatedmeteogram.mp4', writer='imagemagick')
Output

Conclusion
We learned how to create an animated Meteogram in Python using 2 different libraries. Animated Meteograms can also be visually appealing and engaging, making them useful for educational or communication purposes to effectively convey weather information to a wider audience.

