
Article Categories
- All Categories
-
 Data Structure
-
 Networking
-
 RDBMS
RDBMS
-
 Operating System
-
 Java
Java
-
 MS Excel
-
 iOS
iOS
-
 HTML
HTML
-
 CSS
CSS
-
 Android
-
 Python
-
 C Programming
-
 C++
C++
-
 C#
C#
-
 MongoDB
-
 MySQL
MySQL
-
 Javascript
-
 PHP
PHP
-
 Economics & Finance
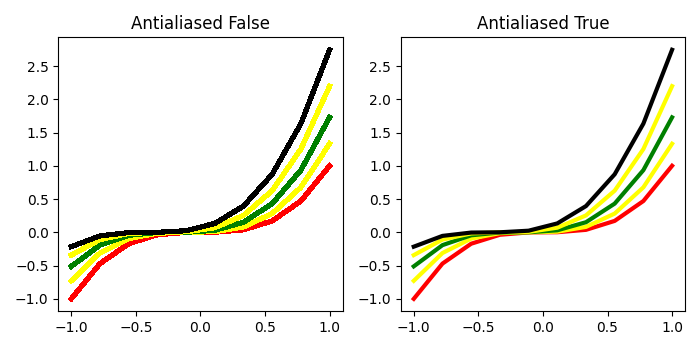
How to change the strength of antialiasing in Matplotlib?
We can change the strength of antialiasing by using True or False flag in the argument of plot() method.
Steps
Create x data points and colors list with different colors.
Defining a method that accepts antialiased flag and axis.
We can iterate in the range of 5, to print 5 different colors of curves from x data points (Step 1).
Create a new figure or activate an existing figure.
Add an axis to the figure as part of a subplot arrangement, at index 1.
Plot a line with antialiased flag set as False and ax1 (axis 1) and set the title of the figure.
Add an axis to the figure as part of a subplot arrangement, at index 2.
Plot a line with antialiased flag set as False and ax2 (axis 2) and set the title of the figure.
To display the figure, use show() method.
Example
import numpy as np
from matplotlib import pyplot as plt
plt.rcParams["figure.figsize"] = [7.00, 3.50]
plt.rcParams["figure.autolayout"] = True
x = np.linspace(-1, 1, 10)
colors = ["red", "yellow", "green", "yellow", "black"]
def plot(antialiased, ax):
   for i in range(5):
      y = (x + i / 10) * (x + i / 10) ** 2
      ax.plot(x, y, c=colors[i], lw=3, antialiased=antialiased)
fig = plt.figure()
ax1 = fig.add_subplot(121)
plot(False, ax1)
ax1.set_title("Antialiased False")
ax1 = fig.add_subplot(122)
plot(True, ax1)
ax1.set_title("Antialiased True")
plt.show()
Output

1K+ Views
