
Article Categories
- All Categories
-
 Data Structure
-
 Networking
-
 RDBMS
RDBMS
-
 Operating System
-
 Java
Java
-
 MS Excel
-
 iOS
iOS
-
 HTML
HTML
-
 CSS
CSS
-
 Android
-
 Python
-
 C Programming
-
 C++
C++
-
 C#
C#
-
 MongoDB
-
 MySQL
MySQL
-
 Javascript
-
 PHP
PHP
-
 Economics & Finance
Selected Reading
How to change the order of plots in Pandas hist command?
To change order of plots in Pandas hist commad, we can take the following steps −
Make a data frame using Pandas.
Plot a histogram with the data frame.
Plot the data frame in different order.
To display the figure, use show() method.
Example
from matplotlib import pyplot as plt
import pandas as pd
plt.rcParams["figure.figsize"] = [7.50, 3.50]
plt.rcParams["figure.autolayout"] = True
df = pd.DataFrame({'a': [1, 1, 1, 1, 3],
'b': [1, 1, 2, 1, 3],
'c': [2, 2, 2, 1, 3],
})
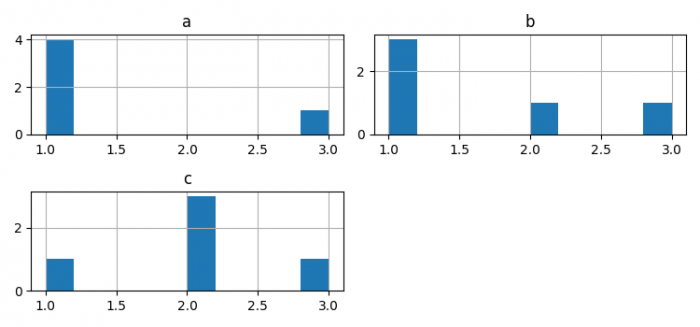
df.hist()
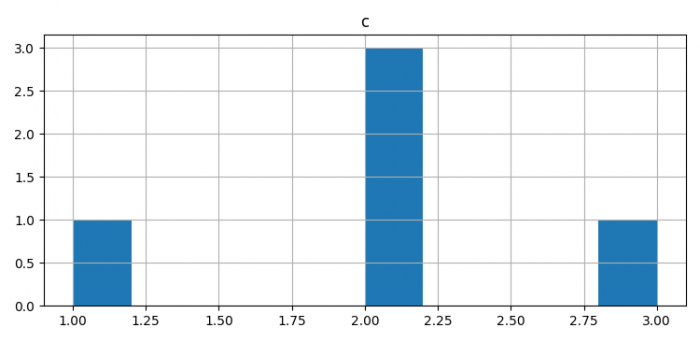
df[['c']].hist()
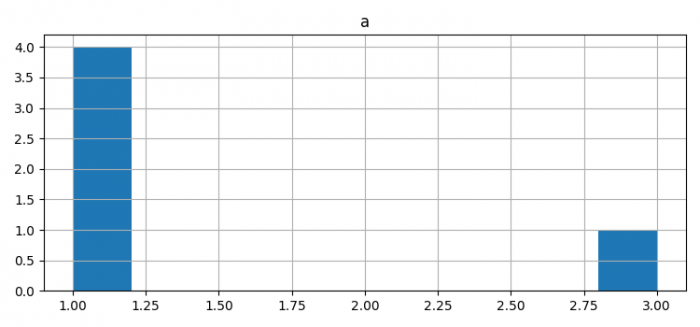
df[['a']].hist()
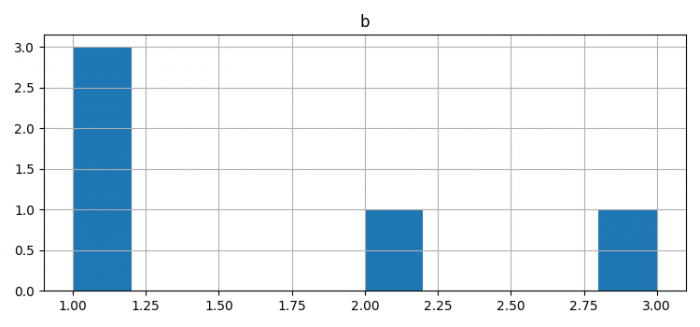
df[['b']].hist()
plt.show()
Output

Updated on: 2021-05-06T13:05:53+05:30
671 Views

Advertisements