
Article Categories
- All Categories
-
 Data Structure
-
 Networking
-
 RDBMS
RDBMS
-
 Operating System
-
 Java
Java
-
 MS Excel
-
 iOS
iOS
-
 HTML
HTML
-
 CSS
CSS
-
 Android
-
 Python
-
 C Programming
-
 C++
C++
-
 C#
C#
-
 MongoDB
-
 MySQL
MySQL
-
 Javascript
-
 PHP
PHP
-
 Economics & Finance
Selected Reading
How do I write a Latex formula in the legend of a plot using Matplotlib inside a .py file?
LaTeX is a typesetting language for producing scientific documents. We use a very small part of the language for writing mathematical notation. Jupyter notebook recognizes LaTeX code written in markdown cells and renders the symbols in the browser using the MathJax JavaScript library.
To write a LaTeX formula in the legend of a plot, we can take the following steps −
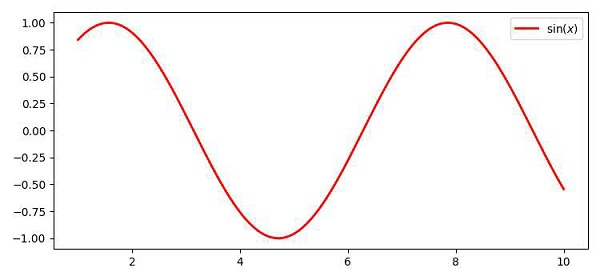
Create data points for x.
Create data point for y, i.e., y=sin(x).
Plot the curve x and y with LaTex representation.
To activate the label, use the legend() method.
To display the figure, use the show() method.
Example
import numpy as np
import matplotlib.pyplot as plt
plt.rcParams["figure.figsize"] = [7.50, 3.50]
plt.rcParams["figure.autolayout"] = True
x = np.linspace(1, 10, 1000)
y = np.sin(x)
plt.plot(x, y, label=r'$\sin (x)$', c="red", lw=2)
plt.legend()
plt.show()
Output
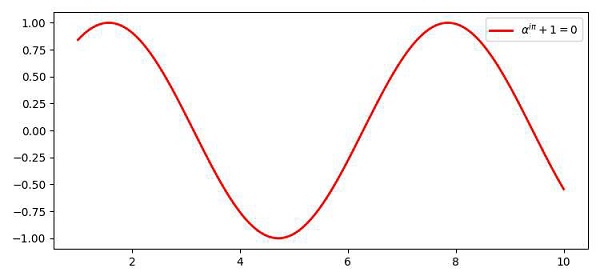
Put a little more complex equation in the label, for example, label=r'$\alpha^{i \pi} + 1 = 0$'
Now, look at the legend at the top-right corner of the plot.

Updated on: 2021-04-09T12:29:47+05:30
5K+ Views

Advertisements