
Article Categories
- All Categories
-
 Data Structure
-
 Networking
-
 RDBMS
RDBMS
-
 Operating System
-
 Java
Java
-
 MS Excel
-
 iOS
iOS
-
 HTML
HTML
-
 CSS
CSS
-
 Android
-
 Python
-
 C Programming
-
 C++
C++
-
 C#
C#
-
 MongoDB
-
 MySQL
MySQL
-
 Javascript
-
 PHP
PHP
-
 Economics & Finance
Selected Reading
Matplotlib savefig with a legend outside the plot
To save a file with legend outside the plot, we can take the following steps −
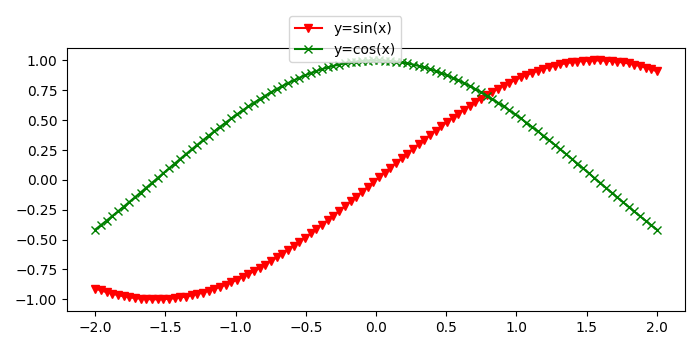
Create x data points using numpy.
Plot y=sin(x) curve using plot() method, with color=red, marker="v" and label y=sin(x).
Plot y=cos(x), curve using plot() method, with color=green, marker="x" and label y=cos(x).
To place the legend outside the plot, use bbox_to_anchor(.45, 1.15) and location="upper center".
To save the figure, use savefig() method.
Example
import numpy as np
from matplotlib import pyplot as plt
plt.rcParams["figure.figsize"] = [7.00, 3.50]
plt.rcParams["figure.autolayout"] = True
x = np.linspace(-2, 2, 100)
plt.plot(x, np.sin(x), c="red", marker="v", label="y=sin(x)")
plt.plot(x, np.cos(x), c="green", marker="x", label="y=cos(x)")
plt.legend(bbox_to_anchor=(.45, 1.15), loc="upper center")
plt.savefig("legend_outside.png")
Output
When we execute this code, it will save the following plot with the name "legend_outside.png" in the current directory.

Updated on: 2021-05-06T13:16:34+05:30
3K+ Views

Advertisements