 Data Structure
 Networking
 RDBMS
RDBMS Operating System
 Java
Java MS Excel
 iOS
iOS HTML
HTML CSS
CSS Android
 Python
 C Programming
 C++
C++ C#
C# MongoDB
 MySQL
MySQL Javascript
 PHP
PHP
- Selected Reading
- UPSC IAS Exams Notes
- Developer's Best Practices
- Questions and Answers
- Effective Resume Writing
- HR Interview Questions
- Computer Glossary
- Who is Who
Horizontal Stripplot with Jitter using Altair in Python
One of the most crucial aspects of data analysis is proficiently visualizing data to pinpoint trends and patterns rapidly and a highly effective tool to visualize categorical and continuous variables is by using a horizontal strip plot with jitter .
Our article will demonstrate how to create horizontal stripplot with Jitter utilizing Altair?a popular Python library renowned for its declarative statistical visualization features.
What are Stripplot and Jitter?
A stripplot displays individual data points in a horizontal arrangement, allowing us to observe their distribution across different categories. However, when multiple data points share the same horizontal position, they can overlap and make it difficult to distinguish individual points. Jitter is a technique that adds a small amount of random noise to the horizontal position of each point, spreading them out and reducing overlap.
Prerequisites
To begin, it's essential to make sure that both Altair and Pandas are installed within our designated Python environment. We can install these Python libraries with the use of pip - a versatile package manager for Python ?
pip install altair pandas
We also need a dataset to work with. For this tutorial, we'll use the "tips" dataset from the Seaborn library, which contains information about the total bill and tip amount for customers at a restaurant, along with other variables such as the day of the week and the customer's gender.
Creating a Horizontal Stripplot with Jitter using Altair
Once we have our prerequisites in place, we can start creating our horizontal stripplot with jitter using Altair.
Follow the steps given below to create a horizontal stripplot with Jitter using Altair ?
Step 1: Install Altair
Before we begin, make sure you have Altair installed in your Python environment. If not, you can install it by running the following command in your terminal ?
pip install altair
Step 2: Import the necessary libraries
In your Python script or Jupyter Notebook, import the required libraries: Altair and pandas.
import altair as alt
import pandas as pd
Step 3: Load the data
Load your dataset into a pandas DataFrame. For example, you can load a CSV file using pd.read_csv() ?
data = pd.read_csv("your_dataset.csv")
Step 4: Create the horizontal stripplot with jitter
Use Altair to create the horizontal stripplot with jitter. Specify the data source, mark type, encoding, and other plot properties ?
chart = alt.Chart(data).mark_circle(size=40, opacity=0.8).encode(
   x=alt.X('continuous_variable:Q', title='X-axis Label'),
   y=alt.Y('categorical_variable:O', title='Y-axis Label'),
   color=alt.Color('group_variable:N', legend=alt.Legend(title='Group')),
   tooltip=['continuous_variable', 'categorical_variable', 'group_variable']
).properties(
   title='Horizontal Stripplot with Jitter',
   width=600,
   height=300
).configure_axis(
   labelFontSize=12,
   titleFontSize=14
).configure_legend(
   labelFontSize=12,
   titleFontSize=14
Replace 'continuous_variable', 'categorical_variable', and 'group_variable' with the appropriate column names from your dataset. Adjust the mark type, size, opacity, and other properties as desired.
Step 5: Display or save the plot
You can display the plot directly in your Jupyter Notebook or save it as an image or HTML file. To display the plot in the notebook, use ?
chart.show()
To save the plot as an image, use .save() and specify the filename with the desired format (e.g., 'plot.png') ?
chart.save('plot.png')
Alternatively, you can save the plot as an interactive HTML file using .save() ?
chart.save('plot.html')
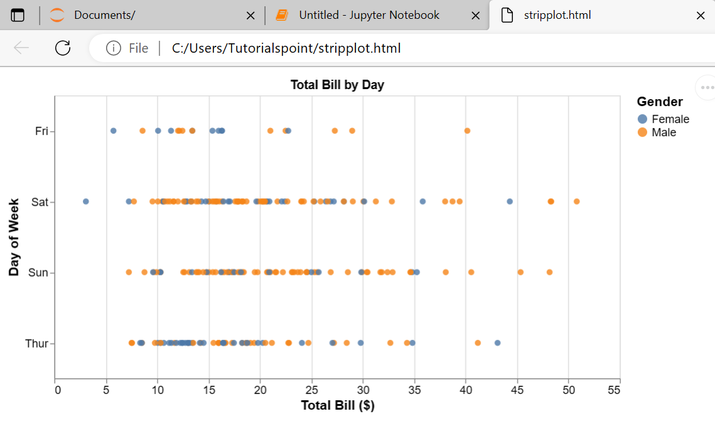
Below is the complete code to plot horizontal Stripplot with Jitter using Altair in Python by using the tips dataset.
Example
import altair as alt
import pandas as pd

# Load example dataset
tips = pd.read_csv("https://raw.githubusercontent.com/mwaskom/seaborn-data/master/tips.csv")

# Create horizontal stripplot with jitter
chart = alt.Chart(tips).mark_circle(size=40, opacity=0.8).encode(
   x=alt.X('total_bill:Q', title='Total Bill ($)'),
   y=alt.Y('day:O', title='Day of Week'),
   color=alt.Color('sex:N', legend=alt.Legend(title='Gender')),
   tooltip=['total_bill', 'day', 'sex']
).properties(
   title='Total Bill by Day',
   width=600,
   height=300
).configure_axis(
   labelFontSize=12,
   titleFontSize=14
).configure_legend(
   labelFontSize=12,
   titleFontSize=14
)

# Save plot to HTML file
chart.save('stripplot.html')
Output

Conclusion
In conclusion, creating a horizontal stripplot with jitter using Altair in Python is a simple and powerful way to visualize the relationship between categorical and continuous variables in your datasets. Altair provides a declarative and intuitive syntax for creating visually appealing plots with customizable properties.
By following the steps outlined in this article, you can easily load your data, specify the necessary encodings, and customize various aspects of the stripplot such as size, opacity, color, and tooltip information. The addition of jitter helps to avoid overlapping points, allowing for a clearer understanding of data density and distribution within different categories.

