 Data Structure
 Networking
 RDBMS
RDBMS Operating System
 Java
Java MS Excel
 iOS
iOS HTML
HTML CSS
CSS Android
 Python
 C Programming
 C++
C++ C#
C# MongoDB
 MySQL
MySQL Javascript
 PHP
PHP
- Selected Reading
- UPSC IAS Exams Notes
- Developer's Best Practices
- Questions and Answers
- Effective Resume Writing
- HR Interview Questions
- Computer Glossary
- Who is Who
Horizontal Boxplots with Points using Seaborn in Python
Boxplots are one of the most popular tools available for data visualization of the datasets which is mainly created using a python library called Seaborn, which provides a simple and powerful way to create both horizonatal and vertical boxplots and other types of visualizations.
In this article, we will be focusing on how to create a horizontal boxplot with points using Seaborn in Python.
What is a boxplot?
First of all, let's define what a boxplot is. A boxplot is a graphical representation of the dataset that convey the distribution of the data in the dataset using outliers, quartiles, and median. The box in the middle of the plot represents the interquartile range (IQR) of the data, with the whiskers extending to the minimum and maximum values that fall within a certain distance from the median. Outliers are represented as individual points outside of the whiskers.
Horizontal boxplots with Points using Seaborn
Let's get started with how we can create a horizontal boxplot with points using Seaborn in Python. We will use a dataset from the Seaborn library called "tips", which contains information that has columns total bill amount and the day of the week at the restaurant.
Below are the steps that we will follow to create a horizontal boxplot with points using Seaborn in Python ?
Import all the necessary libraries like seaborn and matplotlib.
load the "tips" dataset using the sns.load_dataset() function ?
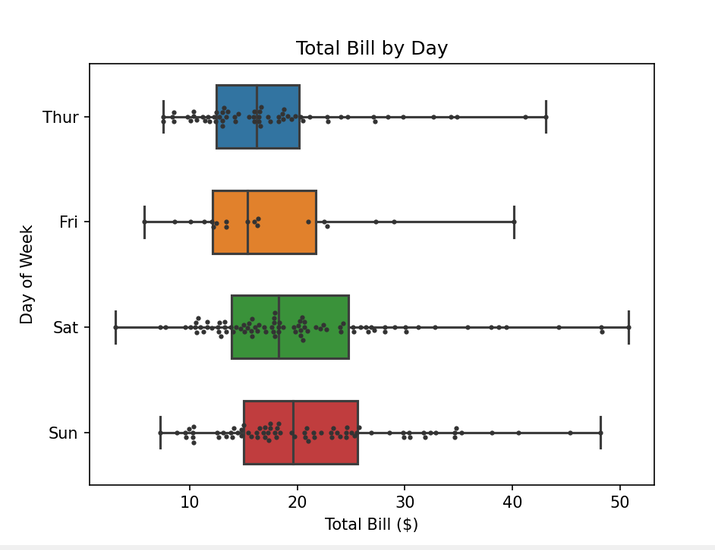
We can then create a horizontal boxplot using the sns.boxplot() function.
We set the x and y variables to "total_bill" and "day", respectively, to plot the total bill amount on the x-axis and the day of the week on the y-axis.
We also set the whis parameter to [0, 100] to show the full range of the data, and adjust the width of the boxplots and the size of the outliers using the width and fliersize parameters.
Finally, we set the orient parameter to "h" to create a horizontal boxplot.
Next, we can add individual data points to the plot using the sns.swarmplot() function.
We again set the x and y variables to "total_bill" and "day", and adjust the size and color of the points using the size and color parameters.
We also set the orient parameter to "h" to create a horizontal swarmplot.
Finally, we add a title and axis labels to the plot using the standard Matplotlib functions plt.title(), plt.xlabel(), and plt.ylabel().
We can then show the plot using the plt.show() function
Example
import seaborn as snsb
import matplotlib.pyplot as pltt

# Load example dataset
tips_df = snsb.load_dataset("tips")

# Create horizontal boxplot with points
snsb.boxplot(x="total_bill", y="day", data=tips_df, whis=[0, 100], width=.6, fliersize=5, orient="h")
snsb.swarmplot(x="total_bill", y="day", data=tips_df, color=".2", size=3, orient="h")

# Add title and axis labels
pltt.title("Total Bill by Day")
pltt.xlabel("Total Bill ($)")
pltt.ylabel("Day of Week")

# Show plot
pltt.show()
Output

Program for customized horizontal boxplot
import seaborn as snss
import matplotlib.pyplot as pltt

# Load example dataset
tips_df = snss.load_dataset("tips")

# Set style and color palette
snss.set_style("whitegrid")
snss.set_palette("husl")

# Create horizontal boxplot with points
snss.boxplot(x="total_bill", y="day", data=tips_df, whis=[0, 100], width=.6, fliersize=5, orient="h")
snss.swarmplot(x="total_bill", y="day", data=tips_df, color="black", size=4, orient="h")

# Customize plot appearance
pltt.title("Total Bill by Day", fontsize=14, fontweight="bold")
pltt.xlabel("Total Bill ($)", fontsize=12)
pltt.ylabel("Day of Week", fontsize=12)
pltt.xticks(fontsize=10)
pltt.yticks(fontsize=10)

# Adjust plot dimensions
pltt.figure(figsize=(8, 6))

# Show plot
pltt.show()
Output

In the above customized program, we start by importing the necessary libraries, including Seaborn and Matplotlib.
Load an example dataset called "tips" using the sns.load_dataset() function from Seaborn.
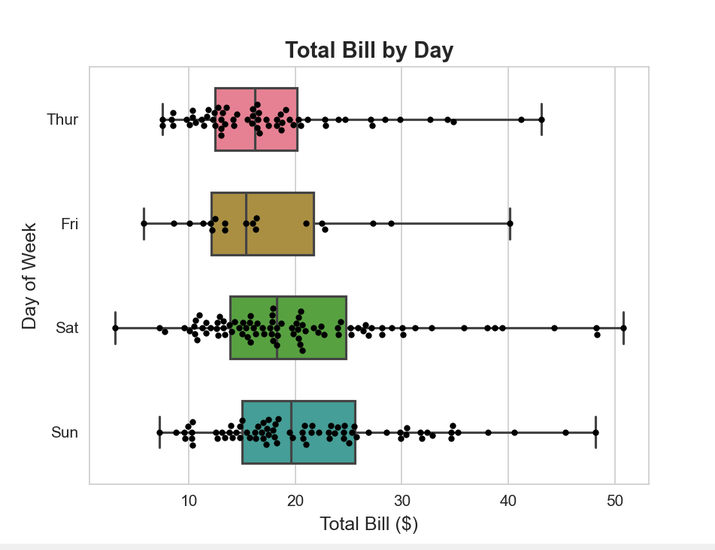
Customize the appearance of the plot by setting the style to "whitegrid" using sns.set_style(). Additionally, we set the color palette to "husl" using sns.set_palette().
Create the horizontal boxplot using sns.boxplot(), specifying the x and y variables as "total_bill" and "day" respectively.
We adjust various parameters such as whis, width, and fliersize to customize the appearance of the boxplot.
To add individual data points, we use sns.swarmplot() and customize its color, size, and orientation.
To further customize the plot appearance, we modify the title, xlabel, and ylabel using the plt.title(), plt.xlabel(), and plt.ylabel() functions from Matplotlib.
We also adjust the fontsize of the title, labels, and tick marks using fontsize.
Additionally, we can adjust the dimensions of the plot by specifying the figure size using plt.figure() and passing the desired dimensions as a tuple.
Finally, we use plt.show() to display the customized horizontal boxplot with points.
Conclusion
In conclusion, creating horizontal boxplots with points using Seaborn in Python is an important technique for visualization datasets, data distributions, and exploring the relationships between different variables. We have utilized the boxplot() and swarmplot() functions of the seaborn to create visually appealing horizontal boxplots that depict the key statistical measures such as medians, outliers and quartiles.

