- Elasticsearch - Home
- Elasticsearch - Basic Concepts
- Elasticsearch - Installation
- Elasticsearch - Populate
- Migration between Versions
- Elasticsearch - API Conventions
- Elasticsearch - Document APIs
- Elasticsearch - Search APIs
- Elasticsearch - Aggregations
- Elasticsearch - Index APIs
- Elasticsearch - CAT APIs
- Elasticsearch - Cluster APIs
- Elasticsearch - Query DSL
- Elasticsearch - Mapping
- Elasticsearch - Analysis
- Elasticsearch - Modules
- Elasticsearch - Index Modules
- Elasticsearch - Ingest Node
- Elasticsearch - Managing Index Lifecycle
- Elasticsearch - SQL Access
- Elasticsearch - Monitoring
- Elasticsearch - Rollup Data
- Elasticsearch - Frozen Indices
- Elasticsearch - Testing
- Elasticsearch - Kibana Dashboard
- Elasticsearch - Filtering by Field
- Elasticsearch - Data Tables
- Elasticsearch - Region Maps
- Elasticsearch - Pie Charts
- Elasticsearch - Area and Bar Charts
- Elasticsearch - Time Series
- Elasticsearch - Tag Clouds
- Elasticsearch - Heat Maps
- Elasticsearch - Canvas
- Elasticsearch - Logs UI
- Elasticsearch Useful Resources
- Elasticsearch - Quick Guide
- Elasticsearch - Useful Resources
- Elasticsearch - Discussion
Elasticsearch - Time Series
Time series is a representation of sequence of data in a specific time sequence. For example, the data for each day starting from first day of the month to the last day. The interval between the data points remains constant. Any data set which has a time component in it can be represented as a time series.
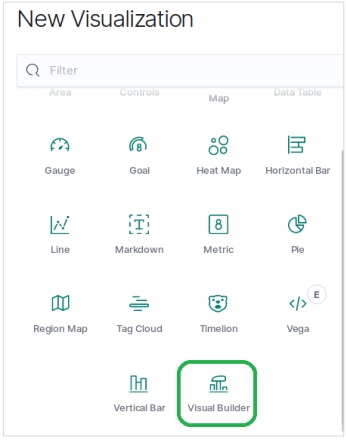
In this chapter, we will use the sample e-commerce data set and plot the count of the number of orders for each day to create a time series.
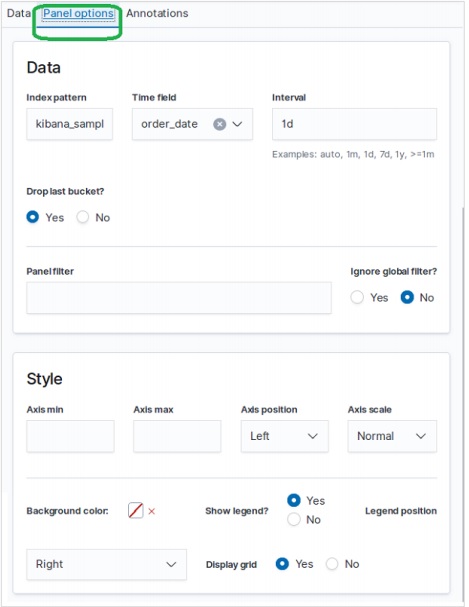
Choose Metrics
First, we choose the index pattern, data field and interval which will be used for creating the time series. From the sample ecommerce data set we choose order_date as the field and 1d as the interval. We use the Panel Options tab to make these choices. Also we leave the other values in this tab as default to get a default colour and format for the time series.
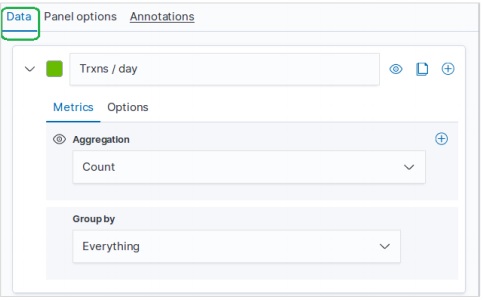
In the Data tab, we choose count as the aggregation option, group by option as everything and put a label for the time series chart.
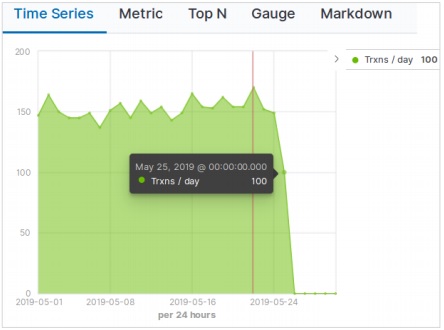
Result
The final result of this configuration appears as follows. Please note that we are using a time period of Month to Date for this graph. Different time periods will give different results.