- Elasticsearch - Home
- Elasticsearch - Basic Concepts
- Elasticsearch - Installation
- Elasticsearch - Populate
- Migration between Versions
- Elasticsearch - API Conventions
- Elasticsearch - Document APIs
- Elasticsearch - Search APIs
- Elasticsearch - Aggregations
- Elasticsearch - Index APIs
- Elasticsearch - CAT APIs
- Elasticsearch - Cluster APIs
- Elasticsearch - Query DSL
- Elasticsearch - Mapping
- Elasticsearch - Analysis
- Elasticsearch - Modules
- Elasticsearch - Index Modules
- Elasticsearch - Ingest Node
- Elasticsearch - Managing Index Lifecycle
- Elasticsearch - SQL Access
- Elasticsearch - Monitoring
- Elasticsearch - Rollup Data
- Elasticsearch - Frozen Indices
- Elasticsearch - Testing
- Elasticsearch - Kibana Dashboard
- Elasticsearch - Filtering by Field
- Elasticsearch - Data Tables
- Elasticsearch - Region Maps
- Elasticsearch - Pie Charts
- Elasticsearch - Area and Bar Charts
- Elasticsearch - Time Series
- Elasticsearch - Tag Clouds
- Elasticsearch - Heat Maps
- Elasticsearch - Canvas
- Elasticsearch - Logs UI
- Elasticsearch Useful Resources
- Elasticsearch - Quick Guide
- Elasticsearch - Useful Resources
- Elasticsearch - Discussion
Elasticsearch - Area and Bar Charts
An area chart is an extension of line chart where the area between the line chart and the axes is highlighted with some colours. A bar chart represents data organized into a range of values and then plotted against the axes. It can consist of either horizontal bars or vertical bars.
In this chapter we will see all these three types of graphs that is created using Kibana. As discussed in earlier chapters we will continue to use the data in the ecommerce index.
Area Chart
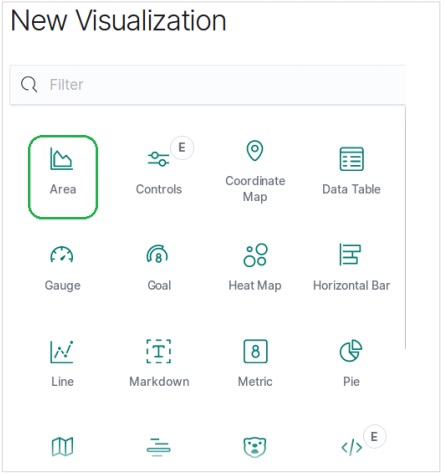
In Kibana Home screen, we find the option name Visualize which allows us to create visualization and aggregations from the indices stored in Elasticsearch. We choose to add a new visualization and select Area Chart as the option shown in the image given below.
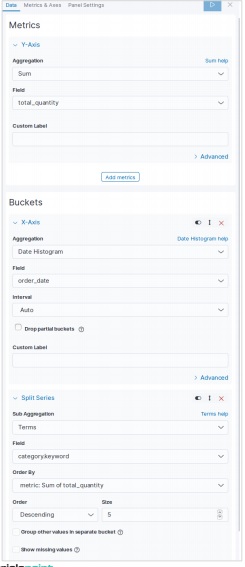
Choose the Metrics
The next screen prompts us for choosing the metrics which will be used in creating the Area Chart. Here we choose the sum as the type of aggregation metric. Then we choose total_quantity field as the field to be used as metric. On the X-axis, we chose the order_date field and split the series with the given metric in a size of 5.
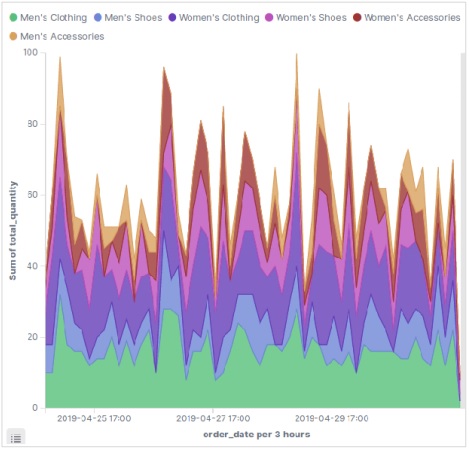
On running the above configuration, we get the following area chart as the output −
Horizontal Bar Chart
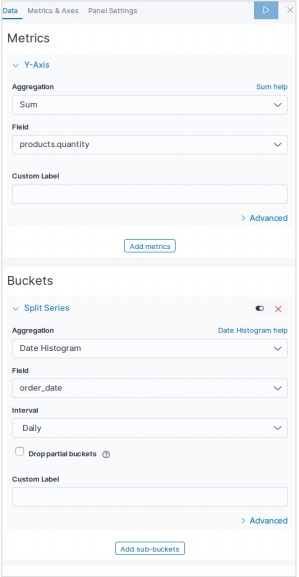
Similarly, for the Horizontal bar chart we choose new visualization from Kibana Home screen and choose the option for Horizontal Bar. Then we choose the metrics as shown in the image below. Here we choose Sum as the aggregation for the filed named product quantity. Then we choose buckets with date histogram for the field order date.
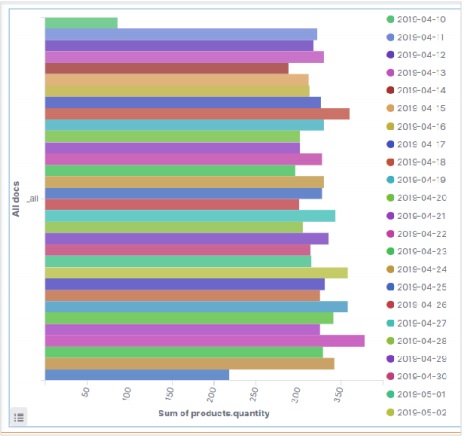
On running the above configuration, we can see a horizontal bar chart as shown below −
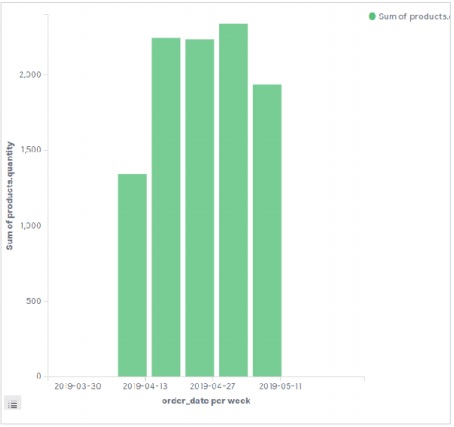
Vertical Bar Chart
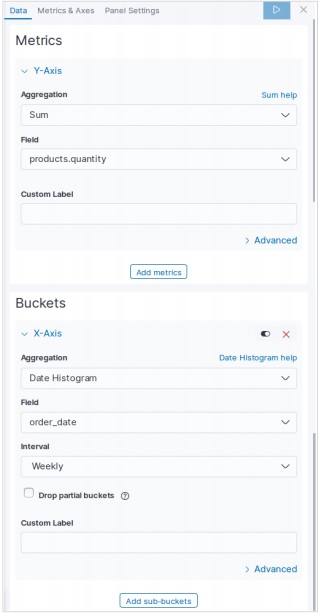
For the vertical bar chart, we choose new visualization from Kibana Home screen and choose the option for Vertical Bar. Then we choose the metrics as shown in the image below.
Here we choose Sum as the aggregation for the field named product quantity. Then we choose buckets with date histogram for the field order date with a weekly interval.
On running the above configuration, a chart will be generated as shown below −