- Elasticsearch - Home
- Elasticsearch - Basic Concepts
- Elasticsearch - Installation
- Elasticsearch - Populate
- Migration between Versions
- Elasticsearch - API Conventions
- Elasticsearch - Document APIs
- Elasticsearch - Search APIs
- Elasticsearch - Aggregations
- Elasticsearch - Index APIs
- Elasticsearch - CAT APIs
- Elasticsearch - Cluster APIs
- Elasticsearch - Query DSL
- Elasticsearch - Mapping
- Elasticsearch - Analysis
- Elasticsearch - Modules
- Elasticsearch - Index Modules
- Elasticsearch - Ingest Node
- Elasticsearch - Managing Index Lifecycle
- Elasticsearch - SQL Access
- Elasticsearch - Monitoring
- Elasticsearch - Rollup Data
- Elasticsearch - Frozen Indices
- Elasticsearch - Testing
- Elasticsearch - Kibana Dashboard
- Elasticsearch - Filtering by Field
- Elasticsearch - Data Tables
- Elasticsearch - Region Maps
- Elasticsearch - Pie Charts
- Elasticsearch - Area and Bar Charts
- Elasticsearch - Time Series
- Elasticsearch - Tag Clouds
- Elasticsearch - Heat Maps
- Elasticsearch - Canvas
- Elasticsearch - Logs UI
- Elasticsearch Useful Resources
- Elasticsearch - Quick Guide
- Elasticsearch - Useful Resources
- Elasticsearch - Discussion
Elasticsearch - Logs UI
Kibana can also help in visualizing log data from various sources. Logs are important sources of analysis for infrastructure health, performance needs and security breach analysis etc. Kibana can connect to various logs like web server logs, elasticsearch logs and cloudwatch logs etc.
Logstash Logs
In Kibana, we can connect to logstash logs for visualization. First we choose the Logs button from the Kibana home screen as shown below −
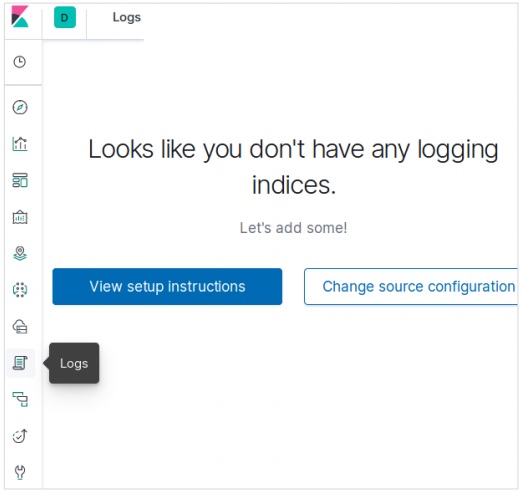
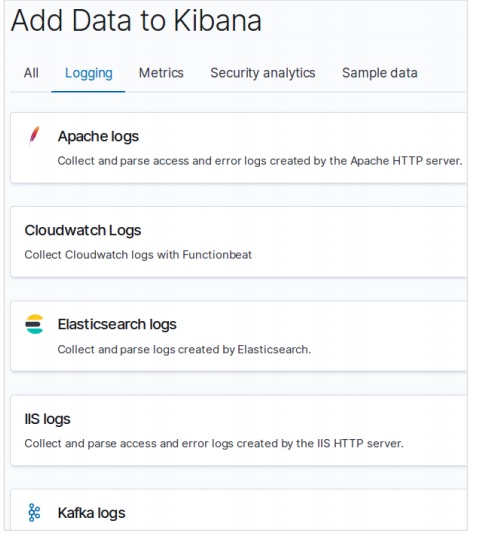
Then we choose the option Change Source Configuration which brings us the option to choose Logstash as a source. The below screen also shows other types of options we have as a log source.
You can stream data for live log tailing or pause streaming to focus on historical log data. When you are streaming logs, the most recent log appears at the bottom on the console.
For further reference, you can refer to our Logstash tutorial.
