- Elasticsearch - Home
- Elasticsearch - Basic Concepts
- Elasticsearch - Installation
- Elasticsearch - Populate
- Migration between Versions
- Elasticsearch - API Conventions
- Elasticsearch - Document APIs
- Elasticsearch - Search APIs
- Elasticsearch - Aggregations
- Elasticsearch - Index APIs
- Elasticsearch - CAT APIs
- Elasticsearch - Cluster APIs
- Elasticsearch - Query DSL
- Elasticsearch - Mapping
- Elasticsearch - Analysis
- Elasticsearch - Modules
- Elasticsearch - Index Modules
- Elasticsearch - Ingest Node
- Elasticsearch - Managing Index Lifecycle
- Elasticsearch - SQL Access
- Elasticsearch - Monitoring
- Elasticsearch - Rollup Data
- Elasticsearch - Frozen Indices
- Elasticsearch - Testing
- Elasticsearch - Kibana Dashboard
- Elasticsearch - Filtering by Field
- Elasticsearch - Data Tables
- Elasticsearch - Region Maps
- Elasticsearch - Pie Charts
- Elasticsearch - Area and Bar Charts
- Elasticsearch - Time Series
- Elasticsearch - Tag Clouds
- Elasticsearch - Heat Maps
- Elasticsearch - Canvas
- Elasticsearch - Logs UI
- Elasticsearch Useful Resources
- Elasticsearch - Quick Guide
- Elasticsearch - Useful Resources
- Elasticsearch - Discussion
Elasticsearch - Data Tables
The data table is type of visualization that is used to display the raw data of a composed aggregation. There are various types of aggregations that are presented by using Data tables. In order to create a Data Table, we should go through the steps that are discussed here in detail.
Visualize
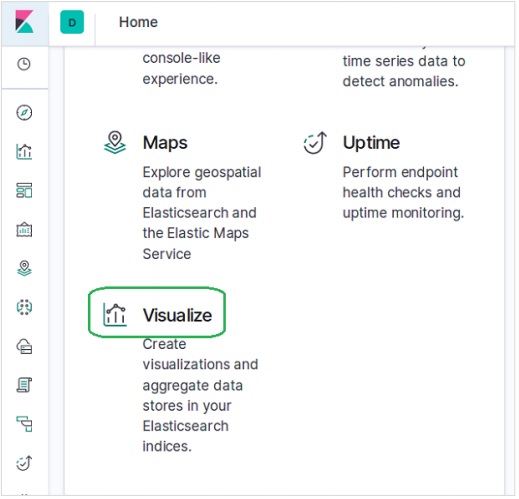
In Kibana Home screen we find the option name Visualize which allows us to create visualization and aggregations from the indices stored in Elasticsearch. The following image shows the option.
Select Data Table
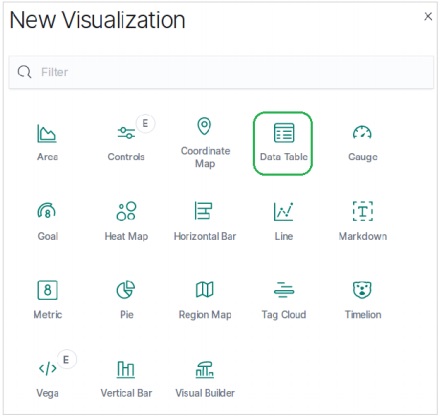
Next, we select the Data Table option from among the various visualization options available. The option is shown in the following image &miuns;
Select Metrics
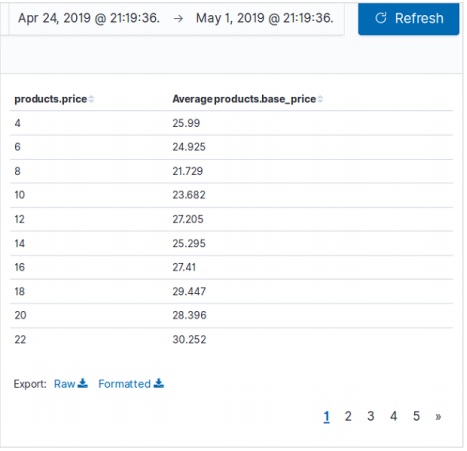
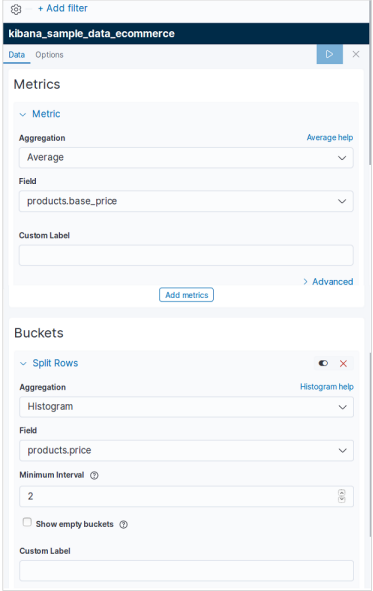
We then select the metrics needed for creating the data table visualization. This choice decides the type of aggregation we are going to use. We select the specific fields shown below from the ecommerce data set for this.
On running the above configuration for Data Table, we get the result as shown in the image here −