
Article Categories
- All Categories
-
 Data Structure
-
 Networking
-
 RDBMS
RDBMS
-
 Operating System
-
 Java
Java
-
 MS Excel
-
 iOS
iOS
-
 HTML
HTML
-
 CSS
CSS
-
 Android
-
 Python
-
 C Programming
-
 C++
C++
-
 C#
C#
-
 MongoDB
-
 MySQL
MySQL
-
 Javascript
-
 PHP
PHP
-
 Economics & Finance
Selected Reading
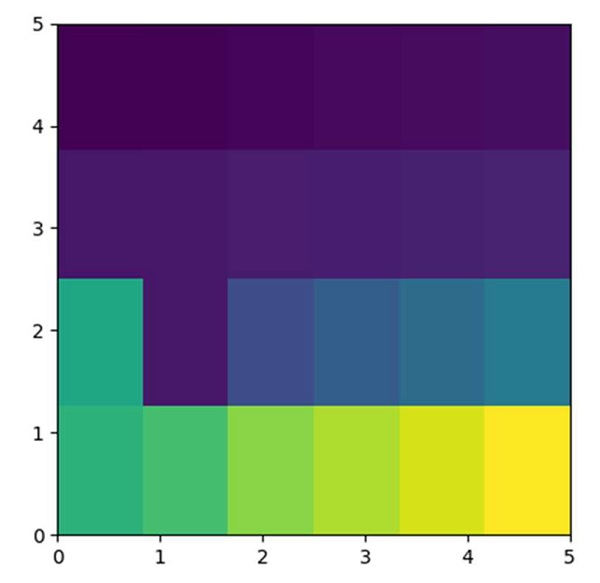
Change values on matplotlib imshow() graph axis
First, we can initialize an array matrix and pass it into the imshow method that can help to get the image for the given matrix.
Steps
Create a 2D Array i.e., img.
Using imshow() method, display the data as an image, i.e., on a 2D regular raster.
Use plt.show() method to show the figure.
Example
import matplotlib.pyplot as plt

img = [[1, 2, 4, 5, 6, 7],
      [11, 12, 14, 15, 16, 17],
      [101, 12, 41, 51, 61, 71],
      [111, 121, 141, 151, 161, 171]]

plt.imshow(img, extent=[0, 5, 0, 5])
plt.show()
Output

Updated on: 2021-03-16T10:21:58+05:30
4K+ Views

Advertisements