
Article Categories
- All Categories
-
 Data Structure
-
 Networking
-
 RDBMS
RDBMS
-
 Operating System
-
 Java
Java
-
 MS Excel
-
 iOS
iOS
-
 HTML
HTML
-
 CSS
CSS
-
 Android
-
 Python
-
 C Programming
-
 C++
C++
-
 C#
C#
-
 MongoDB
-
 MySQL
MySQL
-
 Javascript
-
 PHP
PHP
-
 Economics & Finance
Selected Reading
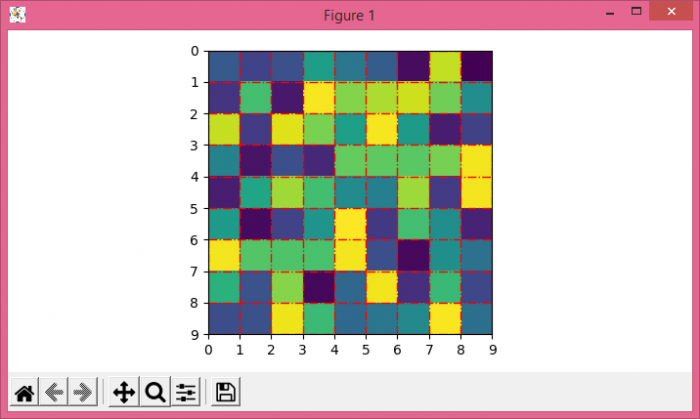
Adjusting gridlines and ticks in Matplotlib imshow
To adjust gridlines and ticks in matplotlib imshow(), we can take the following steps−
- Create data, a 2D array, using numpy.
- Using imshow() method, display data as an image.
- Set xticks and yticks using set_xticks and set_yticks method.
- To set the xticklabels and yticklabels, use set_xticklabels and set_yticklabels method.
- Lay out a grid in current line style. Supply the list of x an y positions using grid() method.
- To display the figure, use show() method.
Example
import numpy as np
from matplotlib import pyplot as plt
plt.rcParams["figure.figsize"] = [7.00, 3.50]
plt.rcParams["figure.autolayout"] = True
data = np.random.rand(9, 9)
plt.imshow(data, interpolation="nearest")
ax = plt.gca()
ax.set_xticks(np.arange(-.5, 9, 1))
ax.set_yticks(np.arange(-.5, 9, 1))
ax.set_xticklabels(np.arange(0, 10, 1))
ax.set_yticklabels(np.arange(0, 10, 1))
ax.grid(color='red', linestyle='-.', linewidth=1)
plt.show()
Output

Updated on: 2021-05-06T13:02:37+05:30
5K+ Views

Advertisements