- Angular Google Charts - Home
- Angular Google Charts - Overview
- Angular Google Charts - Environment Setup
- Angular Google Charts - Configuration Syntax
- Angular Google Charts - Area Charts
- Angular Google Charts - Bar Charts
- Angular Google Charts - Bubble Charts
- Angular Google Charts - Candlestick
- Angular Google Charts - Column Charts
- Angular Google Charts - Combination
- Angular Google Charts - Histogram
- Angular Google Charts - Line Charts
- Angular Google Charts - Maps
- Angular Google Charts - Organization
- Angular Google Charts - Pie Charts
- Angular Google Charts - Sankey Charts
- Angular Google Charts - Scatter Chart
- Angular Google Charts - Stepped Area Charts
- Angular Google Charts - Table Chart
- Angular Google Charts - TreeMap Chart
Angular Google Charts Resources
- Angular Google Charts - Quick Guide
- Angular Google Charts - Resources
- Angular Google Charts - Discussion
Selected Reading
Angular Google Charts - TreeMap Chart
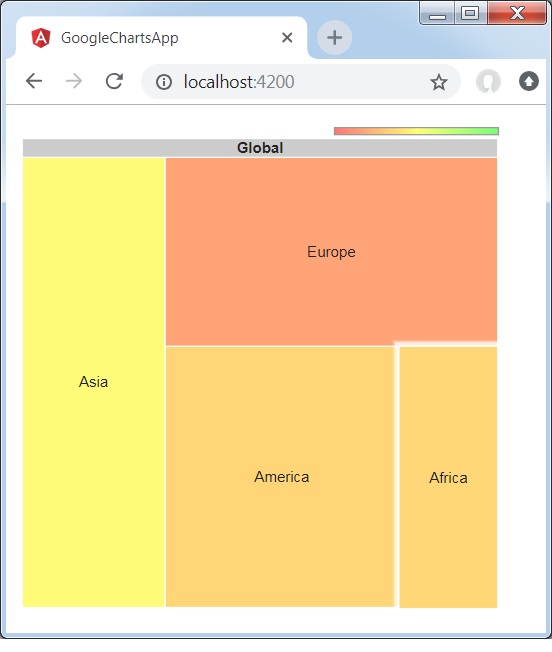
TreeMap is a visual representation of a data tree, where each node may have zero or more children, and one parent (except for the root). Each node is displayed as a rectangle, can be sized and colored according to values that we assign. Sizes and colors are valued relative to all other nodes in the graph. Following is an example of a treemap chart.
We have already seen the configurations used to draw a chart in Google Charts Configuration Syntax chapter. Now, let us see an example of a TreeMap Chart.
Configurations
We've used TreeMap value to show a TreeMap Chart.
type = ChartType.TreeMap;
Example - Usage of TreeMap Chart
app.ts
import { Component, signal } from '@angular/core';
import { ChartType, GoogleChart } from 'angular-google-charts';

@Component({
   selector: 'app-root',
   imports: [GoogleChart],
   templateUrl: './app.html',
   styleUrl: './app.css'
})
export class App {
   protected readonly title = signal('google-charts-app');
   type = ChartType.TreeMap;
   data = [
      ["Global",null,0,0],
      ["America","Global",0,0],
      ["Europe","Global",0,0],
      ["Asia","Global",0,0],
      ["Australia","Global",0,0],
      ["Africa","Global",0,0],

      ["USA","America",52,31],
      ["Mexico","America",24,12],
      ["Canada","America",16,-23],

      ["France","Europe",42,-11],
      ["Germany","Europe",31,-2],
      ["Sweden","Europe",22,-13],

      ["China","Asia",36,4],
      ["Japan","Asia",20,-12],
      ["India","Asia",40,63],

      ["Egypt","Africa",21,0],
      ["Congo","Africa",10,12],
      ["Zaire","Africa",8,10],

   ];
   columnNames = ["Location", "Parent","Market trade volume (size)","Market increase/decrease (color)"];
   options = {
      minColor:"#ff7777",
      midColor:'#ffff77',
      maxColor:'#77ff77',
      headerHeight:15,
      showScale:true
   };
   width = 550;
   height = 400;
}
Result
Verify the result.

Advertisements