- Angular Google Charts - Home
- Angular Google Charts - Overview
- Angular Google Charts - Environment Setup
- Angular Google Charts - Configuration Syntax
- Angular Google Charts - Area Charts
- Angular Google Charts - Bar Charts
- Angular Google Charts - Bubble Charts
- Angular Google Charts - Candlestick
- Angular Google Charts - Column Charts
- Angular Google Charts - Combination
- Angular Google Charts - Histogram
- Angular Google Charts - Line Charts
- Angular Google Charts - Maps
- Angular Google Charts - Organization
- Angular Google Charts - Pie Charts
- Angular Google Charts - Sankey Charts
- Angular Google Charts - Scatter Chart
- Angular Google Charts - Stepped Area Charts
- Angular Google Charts - Table Chart
- Angular Google Charts - TreeMap Chart
Angular Google Charts Resources
- Angular Google Charts - Quick Guide
- Angular Google Charts - Resources
- Angular Google Charts - Discussion
Selected Reading
Angular Google Charts - Table Chart
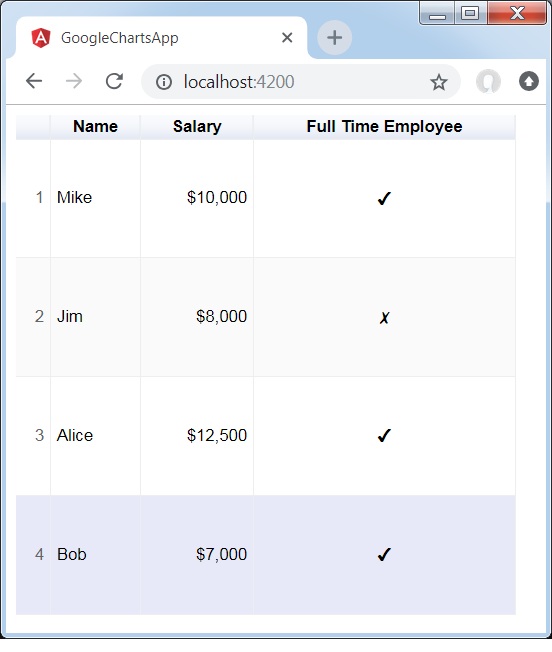
Table chart helps in rendering a table which can be sorted and paged. Table cells can be formatted using format strings, or by directly inserting HTML as cell values. Numeric values are right-aligned by default; boolean values are displayed as check marks or cross marks. Users can select single rows either with the keyboard or the mouse. Column headers can be used for sorting. The header row remains fixed during scrolling. The table fires events corresponding to user interaction.
We have already seen the configurations used to draw a chart in Google Charts Configuration Syntax chapter. Now, let us see an example of a Table Chart.
Configurations
We've used Table value to show a Table Chart.
type = ChartType.Table;
Example - Usage of Table Chart
app.ts
import { Component, signal } from '@angular/core';
import { ChartType, GoogleChart } from 'angular-google-charts';

@Component({
   selector: 'app-root',
   imports: [GoogleChart],
   templateUrl: './app.html',
   styleUrl: './app.css'
})
export class App {
   protected readonly title = signal('google-charts-app');
   type = ChartType.Table;
   data = [
      ['Mike',  {v: 10000, f: '$10,000'}, true],
      ['Jim',   {v:8000,   f: '$8,000'},  false],
      ['Alice', {v: 12500, f: '$12,500'}, true],
      ['Bob',   {v: 7000,  f: '$7,000'},  true]
   ];
   columnNames = ["Name", "Salary","Full Time Employee"];
   options = {
     alternatingRowStyle:true,
     showRowNumber:true
   };
   width = 550;
   height = 400;
}
Result
Verify the result.

Advertisements