- Angular Google Charts - Home
- Angular Google Charts - Overview
- Angular Google Charts - Environment Setup
- Angular Google Charts - Configuration Syntax
- Angular Google Charts - Area Charts
- Angular Google Charts - Bar Charts
- Angular Google Charts - Bubble Charts
- Angular Google Charts - Candlestick
- Angular Google Charts - Column Charts
- Angular Google Charts - Combination
- Angular Google Charts - Histogram
- Angular Google Charts - Line Charts
- Angular Google Charts - Maps
- Angular Google Charts - Organization
- Angular Google Charts - Pie Charts
- Angular Google Charts - Sankey Charts
- Angular Google Charts - Scatter Chart
- Angular Google Charts - Stepped Area Charts
- Angular Google Charts - Table Chart
- Angular Google Charts - TreeMap Chart
Angular Google Charts Resources
- Angular Google Charts - Quick Guide
- Angular Google Charts - Resources
- Angular Google Charts - Discussion
Selected Reading
Angular Google Charts - Configuration Syntax
In this chapter, we will showcase the configuration required to draw a chart using the Google Chart API in Angular.
Step 1 - Create Angular Application
Follow the following steps to update the Angular application we created in Angular Google Charts - Environment Setup chapter −
| Step | Description |
|---|---|
| 1 | Create a project with a name google-charts-app as explained in the Angular Google Charts - Environment Setup chapter. |
| 2 | Modify app.ts and app.html as explained below. Keep rest of the files unchanged. |
| 3 | Compile and run the application to verify the result of the implemented logic. |
Following is the content of the modified HTML host file app.html.
app.html
<google-chart #chart
   [type]="type"
   [data]="data"
   [columns]="columnNames"
   [options]="options"
   [width]="width"
   [height]="height">
</google-chart>
We'll see the updated app.ts in the end after understanding configurations.
Step 2 - Use Configurations
Set Title using Options
options = {
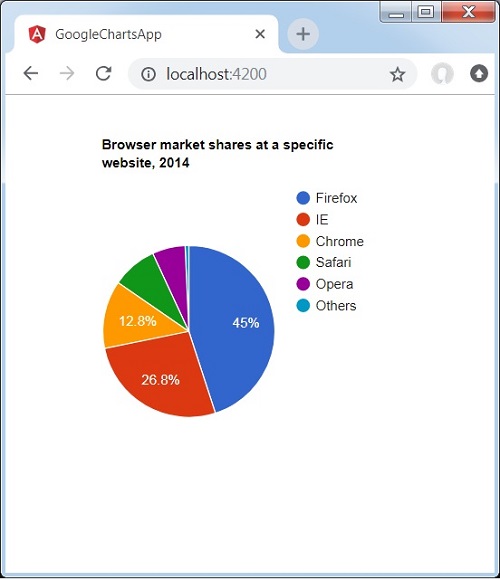
title: 'Browser market shares at a specific website, 2014',
pieHole: 0.4
};
Set Chart Type
type = ChartType.PieChart;
data
Configure the data to be displayed on the chart.
data = [
   ['Firefox', 45.0],
   ['IE', 26.8],
   ['Chrome', 12.8],
   ['Safari', 8.5],
   ['Opera', 6.2],
   ['Others', 0.7]
];
column names
Configure the column names to be displayed.
columnNames = ['Browser', 'Percentage'];
options
Configure the other options.
options = {
   colors: ['#e0440e', '#e6693e', '#ec8f6e', '#f3b49f', '#f6c7b6'], is3D: true
};
Example - Usage of a Google Chart
Consider the following example to further understand the Configuration Syntax −
app.ts
import { Component, signal } from '@angular/core';
import { ChartType, GoogleChart } from 'angular-google-charts';

@Component({
   selector: 'app-root',
   imports: [GoogleChart],
   templateUrl: './app.html',
   styleUrl: './app.css'
})
export class App {
   protected readonly title = signal('google-charts-app');
   type: ChartType = ChartType.PieChart;
   data = [
      ['Firefox', 45.0],
      ['IE', 26.8],
      ['Chrome', 12.8],
      ['Safari', 8.5],
      ['Opera', 6.2],
      ['Others', 0.7]
   ];
   columnNames = ['Browser', 'Percentage'];
   options = {
      title: 'Browser market shares at a specific website, 2014',
      pieHole: 0.4
   };
   width = 550;
   height = 400;
}
Result
Verify the result.

Advertisements