- Agile Data Science - Home
- Agile Data Science - Introduction
- Methodology Concepts
- Agile Data Science - Process
- Agile Tools & Installation
- Data Processing in Agile
- SQL versus NoSQL
- NoSQL & Dataflow programming
- Collecting & Displaying Records
- Data Visualization
- Data Enrichment
- Working with Reports
- Role of Predictions
- Extracting features with PySpark
- Building a Regression Model
- Deploying a predictive system
- Agile Data Science - SparkML
- Fixing Prediction Problem
- Improving Prediction Performance
- Creating better scene with agile & data science
- Implementation of Agile
Selected Reading
Fixing Prediction Problem
In this chapter, we will focus on fixing a prediction problem with the help of a specific scenario.
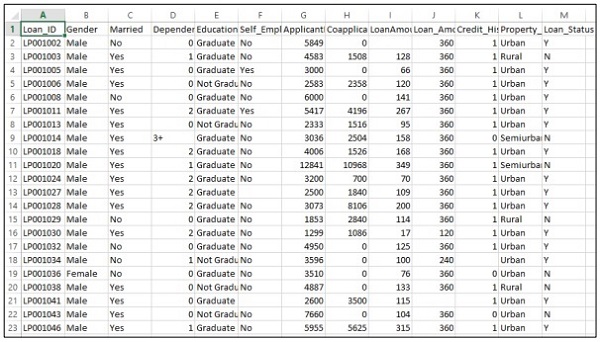
Consider that a company wants to automate the loan eligibility details as per the customer details provided through online application form. The details include name of customer, gender, marital status, loan amount and other mandatory details.
The details are recorded in the CSV file as shown below −
Execute the following code to evaluate the prediction problem −
import pandas as pd
from sklearn import ensemble
import numpy as np

from scipy.stats import mode
from sklearn import preprocessing,model_selection
from sklearn.linear_model import LogisticRegression
from sklearn.preprocessing import LabelEncoder

#loading the dataset
data=pd.read_csv('train.csv',index_col='Loan_ID')
def num_missing(x):
   return sum(x.isnull())

#imputing the the missing values from the data
data['Gender'].fillna(mode(list(data['Gender'])).mode[0], inplace=True)
data['Married'].fillna(mode(list(data['Married'])).mode[0], inplace=True)
data['Self_Employed'].fillna(mode(list(data['Self_Employed'])).mode[0], inplace=True)

# print (data.apply(num_missing, axis=0))
# #imputing mean for the missing value
data['LoanAmount'].fillna(data['LoanAmount'].mean(), inplace=True)
mapping={'0':0,'1':1,'2':2,'3+':3}
data = data.replace({'Dependents':mapping})
data['Dependents'].fillna(data['Dependents'].mean(), inplace=True)
data['Loan_Amount_Term'].fillna(method='ffill',inplace=True)
data['Credit_History'].fillna(method='ffill',inplace=True)
print (data.apply(num_missing,axis=0))

#converting the cateogorical data to numbers using the label encoder
var_mod = ['Gender','Married','Education','Self_Employed','Property_Area','Loan_Status']
le = LabelEncoder()
for i in var_mod:
   le.fit(list(data[i].values))
   data[i] = le.transform(list(data[i]))

#Train test split
x=['Gender','Married','Education','Self_Employed','Property_Area','LoanAmount', 'Loan_Amount_Term','Credit_History','Dependents']
y=['Loan_Status']
print(data[x])
X_train,X_test,y_train,y_test=model_selection.train_test_split(data[x],data[y], test_size=0.2)

#
# #Random forest classifier
# clf=ensemble.RandomForestClassifier(n_estimators=100,
criterion='gini',max_depth=3,max_features='auto',n_jobs=-1)
clf=ensemble.RandomForestClassifier(n_estimators=200,max_features=3,min_samples
   _split=5,oob_score=True,n_jobs=-1,criterion='entropy')

clf.fit(X_train,y_train)
accuracy=clf.score(X_test,y_test)
print(accuracy)
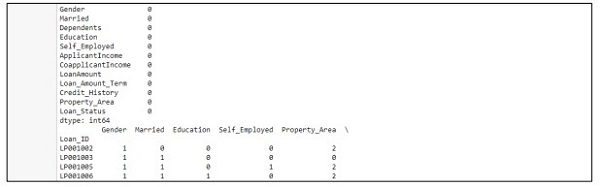
Output
The above code generates the following output.

Advertisements