- Agile Data Science - Home
- Agile Data Science - Introduction
- Methodology Concepts
- Agile Data Science - Process
- Agile Tools & Installation
- Data Processing in Agile
- SQL versus NoSQL
- NoSQL & Dataflow programming
- Collecting & Displaying Records
- Data Visualization
- Data Enrichment
- Working with Reports
- Role of Predictions
- Extracting features with PySpark
- Building a Regression Model
- Deploying a predictive system
- Agile Data Science - SparkML
- Fixing Prediction Problem
- Improving Prediction Performance
- Creating better scene with agile & data science
- Implementation of Agile
Deploying a predictive system
In this example, we will learn how to create and deploy predictive model which helps in the prediction of house prices using python script. The important framework used for deployment of predictive system includes Anaconda and Jupyter Notebook.
Follow these steps to deploy a predictive system −
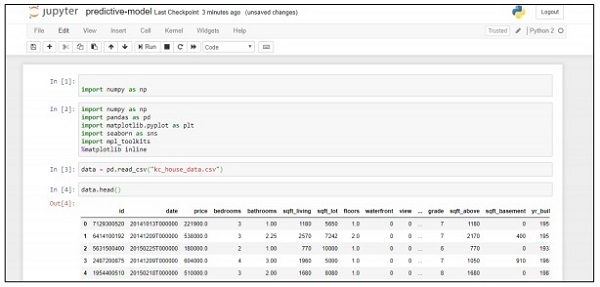
Step 1 − Implement the following code to convert values from csv files to associated values.
import numpy as np
import pandas as pd
import matplotlib.pyplot as plt
import seaborn as sns
import mpl_toolkits

%matplotlib inline
data = pd.read_csv("kc_house_data.csv")
data.head()
The above code generates the following output −
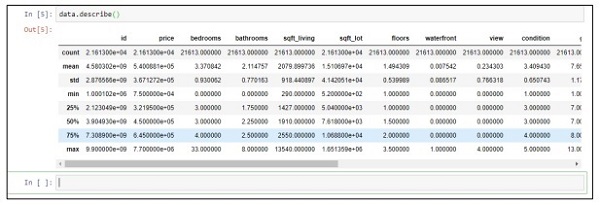
Step 2 − Execute the describe function to get the data types included in attributed of csv files.
data.describe()
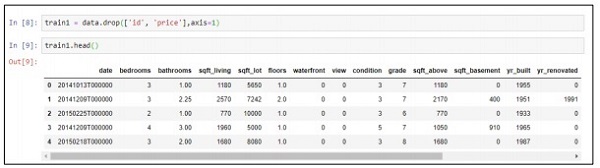
Step 3 − We can drop the associated values based on the deployment of the predictive model that we created.
train1 = data.drop(['id', 'price'],axis=1)
train1.head()
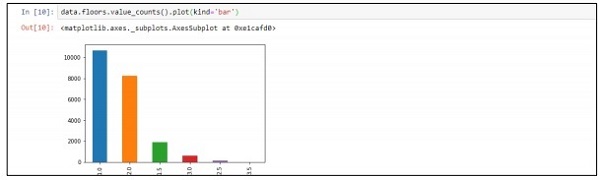
Step 4 − You can visualize the data as per the records. The data can be used for data science analysis and output of white papers.
data.floors.value_counts().plot(kind='bar')