- GWT Highcharts Tutorial
- GWT Highcharts - Home
- GWT Highcharts - Overview
- Environment Setup
- Configuration Syntax
- GWT Highcharts - Line Charts
- GWT Highcharts - Area Charts
- GWT Highcharts - Bar Charts
- GWT Highcharts - Column Charts
- GWT Highcharts - Pie Charts
- GWT Highcharts - Scatter Chart
- GWT Highcharts - Dynamic Charts
- GWT Highcharts - Combinations
- GWT Highcharts - 3D Charts
- GWT Highcharts - Map Charts
- GWT Highcharts Useful Resources
- GWT Highcharts - Quick Guide
- GWT Highcharts - Useful Resources
- GWT Highcharts - Discussion
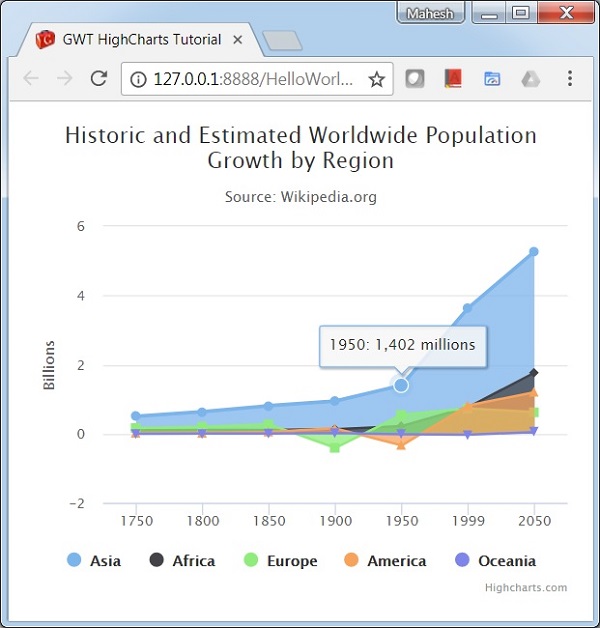
Area Chart with negative values
We have already seen the configuration used to draw this chart in Highcharts Configuration Syntax chapter. Let us now consider the following example to further understand a basic area chart.
Example
HelloWorld.java
package com.tutorialspoint.client;

import org.moxieapps.gwt.highcharts.client.Chart;
import org.moxieapps.gwt.highcharts.client.Series.Type;
import org.moxieapps.gwt.highcharts.client.ToolTip;
import org.moxieapps.gwt.highcharts.client.ToolTipData;
import org.moxieapps.gwt.highcharts.client.ToolTipFormatter;

import org.moxieapps.gwt.highcharts.client.XAxis;
import org.moxieapps.gwt.highcharts.client.YAxis;
import org.moxieapps.gwt.highcharts.client.labels.AxisLabelsData;
import org.moxieapps.gwt.highcharts.client.labels.AxisLabelsFormatter;
import org.moxieapps.gwt.highcharts.client.labels.YAxisLabels;

import org.moxieapps.gwt.highcharts.client.plotOptions.AreaPlotOptions;
import org.moxieapps.gwt.highcharts.client.plotOptions.Marker;
import org.moxieapps.gwt.highcharts.client.plotOptions.PlotOptions.Stacking;

import com.google.gwt.core.client.EntryPoint;
import com.google.gwt.i18n.client.NumberFormat;
import com.google.gwt.user.client.ui.RootPanel;

public class HelloWorld implements EntryPoint {
   public void onModuleLoad() {
      Chart chart = new Chart()
         .setType(Type.AREA)
         .setChartTitleText("Historic and Estimated Worldwide Population Growth by Region")
         .setChartSubtitleText("Source: Wikipedia.org")
         .setToolTip(new ToolTip()
         .setFormatter(new ToolTipFormatter() {
            @Override
            public String format(ToolTipData toolTipData) {
               return toolTipData.getXAsString() + ": " +
                  NumberFormat.getFormat("#,###").format(toolTipData.getYAsDouble()) + " millions";
            }
         }));

         XAxis xAxis = chart.getXAxis();
         xAxis.setCategories("1750", "1800", "1850", "1900", "1950", "1999", "2050");
         xAxis.setTickmarkPlacement(XAxis.TickmarkPlacement.ON);
         xAxis.setAxisTitleText(null);

         YAxis yAxis = chart.getYAxis();
         yAxis.setAxisTitleText("Billions");
         yAxis.setLabels(new YAxisLabels()
            .setFormatter(new AxisLabelsFormatter() {
               @Override
               public String format(AxisLabelsData axisLabelsData) {
                  return String.valueOf(axisLabelsData.getValueAsLong() / 1000);
               }
            }));

         chart.addSeries(chart.createSeries()
            .setName("Asia")
            .setPoints(new Number[] { 502, 635, 809, 947, 1402, 3634, 5268 })
         );
         chart.addSeries(chart.createSeries()
            .setName("Africa")
            .setPoints(new Number[] { 106, 107, 111, 133, 221, 767, 1766 })
         );
         chart.addSeries(chart.createSeries()
            .setName("Europe")
            .setPoints(new Number[] { 163, 203, 276, -408, 547, 729, 628 })
         );
         chart.addSeries(chart.createSeries()
            .setName("America")
            .setPoints(new Number[] { 18, 31, 54, 156, -339, 818, 1201 })
         );
         chart.addSeries(chart.createSeries()
            .setName("Oceania")
            .setPoints(new Number[] { -2, 2, 2, 16, -13, -30, 46 })
         );
      RootPanel.get().add(chart);
   }
}
Result
Verify the result.
gwt_highcharts_area_charts.htm
Advertisements
To Continue Learning Please Login